Topics In This Section: About the Department of Health and Human Services | Performance Goals, Objectives, and Results | Systems, Legal Compliance, and Internal Controls | Management Assurances | Looking Ahead to 2016 | Analysis of Financial Statements and Stewardship Information
About the Department of Health and Human Services
 The Department of Health and Human Services (HHS or the Department) is the United States (U.S.) government’s principal agency for protecting the health of all Americans, providing essential human services, and promoting economic and social well-being for individuals, families, and communities, including seniors and individuals with disabilities. HHS represents almost a quarter of all federal outlays and administers more grant dollars than all other federal agencies combined. HHS’s Medicare program is the nation’s largest health insurer, handling more than one billion claims per year. Medicare and Medicaid together provide health care insurance for 1 in 3 Americans.
HHS works closely with state and local governments and many HHS-funded services are provided at the local level by state or county agencies, or through private sector grantees. The HHS Office of the Secretary (OS) and its 11 Operating Divisions (OpDivs) administer more than 300 programs, covering a wide spectrum of activities. In addition to the services they deliver, HHS programs provide for equitable treatment of beneficiaries nationwide and enable the collection of national health and other data.
Our vision is to provide the building blocks that Americans need to live healthy, successful lives. Each HHS OpDiv contributes to our mission and vision as follows:
 The Administration for Children and Families (ACF) is responsible for federal programs that promote the economic and social well-being of families, children, individuals, and communities. ACF programs aim to empower families and individuals to increase their economic independence and productivity, and encourage strong, healthy, supportive communities that have a positive impact on quality of life and the development of children. For more information, refer to ACF's website.
The Administration for Community Living (ACL) is the single agency charged to work with states, localities, tribal organizations, nonprofit organizations, businesses, and families to help older adults and people with disabilities live independently and fully participate in their communities. ACL’s mission is to maximize the independence, well-being, and health of older adults, people with disabilities across the lifespan, and their families and caregivers. For more information, refer to ACL's website.
The Agency for Healthcare Research and Quality’s (AHRQ) mission is to produce evidence to make health care safer, higher quality, more accessible, equitable, and affordable, and to work within HHS and with other partners to make sure that the evidence is understood and used. This mission is supported by focusing on (1) improving health care quality, (2) making health care safer, (3) increasing accessibility, and (4) improving health care affordability, efficiency, and cost transparency. For more information, refer to AHRQ's website.
The Agency for Toxic Substances and Disease Registry (ATSDR) is charged with the prevention of exposure to toxic substances and the prevention of the adverse health effects and diminished quality of life associated with exposure to hazardous substances from waste sites, unplanned releases, and other sources of pollution present in the environment. For more information, refer to ATSDR's website.
The Centers for Disease Control and Prevention (CDC) collaborates to create the expertise, information, and tools that people and communities need to protect their health through health promotion, prevention of disease, injury and disability, and preparedness for new health threats. CDC works to protect America from health, safety, and security threats, both foreign and domestic. Whether diseases start at home or abroad, are chronic or acute, curable or preventable, human error or deliberate attack, CDC fights disease and supports communities and citizens to do the same. For more information, refer to CDC's website.
The Centers for Medicare & Medicaid Services (CMS) administers public insurance programs that serve as the primary sources of health care coverage for seniors and a large population of medically vulnerable individuals. CMS acts as a catalyst for enormous changes in the availability and quality of health care for all Americans. In addition to these programs, CMS has the responsibility to ensure effective, up-to-date health care coverage, and to promote quality care for beneficiaries. CMS is also responsible for helping to implement many provisions of the Patient Protection and Affordable Care Act (Affordable Care Act), such as the establishment of the Federally Facilitated Marketplace (FFM). For more information, refer to CMS's website.
 The Food and Drug Administration (FDA) is responsible for protecting the public health by assuring the safety, efficacy, and security of human and veterinary drugs, biological products, medical devices, our nation’s food supply, cosmetics, and products that emit radiation.
FDA is also responsible for advancing the public health by helping to speed innovations that make medicines more effective, safer, and more affordable and by helping the public get the accurate, science-based information they need to use medicines and foods to maintain and improve their health. FDA also has responsibility for regulating the manufacturing, marketing, and distribution of tobacco products to protect the public health and to reduce tobacco use by minors.
Finally, FDA plays a significant role in the nation’s counterterrorism capability. FDA fulfills this responsibility by ensuring the security of the food supply and by fostering development of medical products to respond to deliberate and naturally emerging public health threats. For more information, refer to FDA's website.
The Health Resources and Services Administration (HRSA) is responsible for improving access to health care by strengthening the health care workforce, building healthy communities, and achieving health equity. HRSA’s programs provide health care to people who are geographically isolated, and economically, or medically vulnerable. For more information, refer to HRSA's website.
The Indian Health Service (IHS) is responsible for providing federal health services to American Indians and Alaska Natives. The provision of health services to members of federally recognized tribes grew out of the special government-to-government relationship between the federal government and Indian tribes. IHS is the principal federal health care provider and health advocate for the Indian people, with the goal of raising Indian health status to the highest possible level. IHS provides a comprehensive health service delivery system for approximately 2.2 million American Indians and Alaska Natives who belong to 566 federally recognized tribes in 35 states. For more information, refer to IHS's website.
The National Institutes of Health (NIH) seeks fundamental knowledge about the nature and behavior of living systems and the application of that knowledge to enhance health, lengthen life, and reduce illness and disability. For more information, refer to NIH's website.
The Substance Abuse and Mental Health Services Administration (SAMHSA) is responsible for reducing the impact of substance abuse and mental illness on America’s communities. SAMHSA accomplishes its mission by providing leadership, developing service capacity, communicating with the public, setting standards, and improving behavioral health practice in communities, in both primary and specialty care settings. For more information, refer to SAMHSA's website.
The Office of the Secretary (OS), with the Secretary, leads HHS and its 11 OpDivs to provide a wide range of services and benefits to the American people. In addition, the following Staff Divisions (StaffDivs) report directly to the Secretary, managing programs and supporting the OpDivs in carrying out our mission. The StaffDivs are:
- Immediate Office of the Secretary (IOS)
- The Executive Secretariat (ES)
- Office of Health Reform (OHR)
- Office of Intergovernmental and External Affairs (IEA)
- Office of the Assistant Secretary for Administration (ASA)
- Office of the Assistant Secretary for Financial Resources (ASFR)
- Office of the Assistant Secretary for Health (OASH)
- Office of Minority Health (OMH)
- Office of the Assistant Secretary for Legislation (ASL)
- Office of the Assistant Secretary for Planning and Evaluation (ASPE)
- Office of the Assistant Secretary for Preparedness and Response (ASPR)
- Office of the Assistant Secretary for Public Affairs (ASPA)
- Center for Faith-Based and Neighborhood Partnerships (CFBNP)
- Office for Civil Rights (OCR)
- Departmental Appeals Board (DAB)
- Office of the General Counsel (OGC)
- Office of Global Affairs (OGA)
- Office of Inspector General (OIG)
- Office of Medicare Hearings and Appeals (OMHA)
- Office of the National Coordinator for Health Information Technology (ONC)
The Office of the Secretary is directly supported by the Deputy Secretary, Chief of Staff, a number of Assistant Secretaries, Offices, and Operating Divisions.
The following Operating Divisions report directly to the Secretary:
- Administration for Children and Families (ACF)
- Administration for Community Living (ACL)
- Agency for Healthcare Research and Quality (AHRQ)
- Agency for Toxic Substances and Disease Registry (ATSDR)*
- Centers for Disease Control and Prevention (CDC)*
- Centers for Medicare & Medicaid Services (CMS)
- Food and Drug Administration (FDA)*
- Health Resources and Services Administration (HRSA)*
- Indian Health Service (IHS)*
- National Institutes of Health (NIH)*
- Substance Abuse and Mental Health Services Administration (SAMHSA)*
*Components of the Public Health Service
# Administratively-supported by the Office of the Assistant Secretary for Health
Performance Goals, Objectives, and Results
Overview of Strategic and Agency Priority Goals
Every four years HHS updates its strategic plan, which describes its work to address complex, multifaceted, and evolving health and human services issues. An agency strategic plan is 1 of 3 main elements required by the Government Performance and Results Act of 1993 (GPRA) and the GPRA Modernization Act of 2010. The Department’s Strategic Plan (Plan) defines its mission, goals, and the means by which it will measure its progress in addressing specific national problems over a four-year period. In addition, each of the Department’s OpDivs and StaffDivs contribute to the development of the strategic plan, as reflected in the Plan’s strategic goals, objectives, strategies, and performance goals.
The HHS Strategic Plan FY 2014 – 2018 describes the Department’s efforts within the context of broad strategic goals. This Plan identifies four strategic goals and 21 related objectives. The four strategic goals are:
Goal 1: Strengthen Health Care
Goal 2: Advance Scientific Knowledge and Innovation
Goal 3: Advance the Health, Safety, and Well-being of the American People
Goal 4: Ensure Efficiency, Transparency, Accountability, and Effectiveness of HHS Programs
 The strategic goals and associated objectives focus on the major functions of HHS. Although the strategic goals and objectives in the Plan are presented as separate sections, they are interrelated, and successful achievement of one strategic goal or objective can influence the success of others. For example, the application of a promising new scientific discovery (Strategic Goal 2) can affect the quality of health care patients receive (Strategic Goal 1) and/or the success of human service programs (Strategic Goal 3). Improving economic well-being and other social determinants of health (Strategic Goal 3) can improve health outcomes (Strategic Goal 1). Responsible management and stewardship of federal resources (Strategic Goal 4) can create efficiencies the Department can leverage to advance its health, public health, research, and human services goals. For the second consecutive year, HHS conducted an annual Strategic Review, which consisted of various senior Department leaders reviewing performance data, evidence, and other factors for the 21 objectives. The annual review allows HHS leadership to undertake a high-level look at results, challenges, and future initiatives across the Department.
Following is a summary of the strategic goals and objectives established in the FY 2014 – 2018 Plan.
Strategic Goal 2
Advance Scientific Knowledge and Innovation
Objectives
- Accelerate the process of scientific discovery to improve health
- Foster and apply innovative solutions to health, public health, and human services challenges
- Advance the regulatory sciences to enhance food safety, improve medical product development, and support tobacco regulation
- Increase our understanding of what works in public health and human services practice
- Improve laboratory, surveillance, and epidemiology capacity
|
Strategic Goal 1 Objectives
|
Strategic Goal 2 Objectives/strong>
|
|
Strategic Goal 3 Objectives
|
Strategic Goal 4 Objectives
|
Looking Back at FY 2014 Performance and Budget
It is helpful to look at how HHS invests resources toward fulfilling the Department’s mission through its strategic goals. Below are two charts that show the proportion of financial resources that are primarily dedicated to achieving each strategic goal.
Although HHS funding here is broken down into strategic goals, many of the programs in HHS are crosscutting in nature and support a number of strategic goals. The chart on the left provides the breakdown of the HHS budget by strategic goal. The majority of the Department’s funding was primarily associated with Goal 1 because of the large amount of money invested in delivering quality care and services through Medicare, Medicaid, and the Children’s Health Insurance Program (CHIP). For FY 2014, of the four strategic goals, 89.4 percent was spent on Goal 1, 2.9 percent on Goal 2, 6.3 percent on Goal 3, and 1.4 percent on Goal 4.
The chart on the right illustrates the HHS budget excluding the costs of Medicare, Medicaid, and CHIP. Of the four strategic goals excluding Medicare, Medicaid, and CHIP, 18.8 percent was spent on Goal 1, 22.4 percent on Goal 2, 48.5 percent on Goal 3, and 10.3 percent on Goal 4.
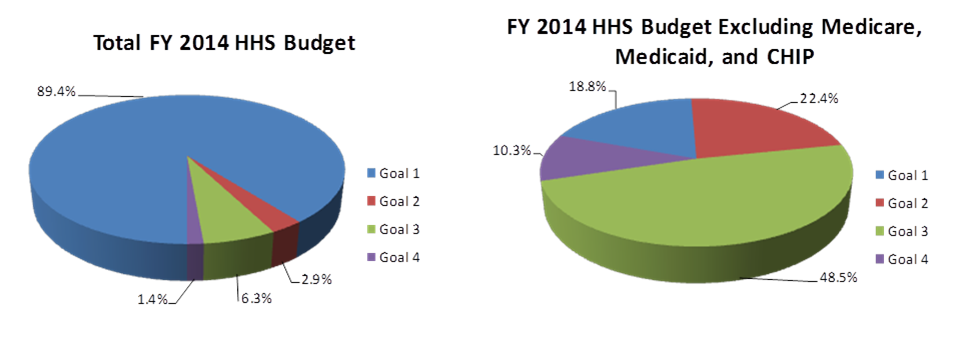
Similar information on resource allocation for FY 2015 strategic goals will be published in the FY 2015 HHS Summary of Performance and Financial Information, available in February 2016 on HHS/About HHS/Budget & Performance. A detailed breakdown of FY 2015 spending by HHS activity and budget function is available in the “Other Information” section of this report.
Performance Management
HHS uses Agency Priority Goals (APGs), also referred to as HHS Priority Goals, to improve performance and accountability. HHS developed APGs by collaborating across the Department to identify activities that would reflect HHS priorities. We utilized the knowledge we gained through collaboration and during data-driven reviews to develop our APGs. These goals are a set of ambitious, but realistic performance objectives that the Department will strive to achieve within a 24-month period. APGs are a limited number of specific performance targets that advance progress toward longer-term outcomes. HHS is currently engaged in five APGs for FY 2014 – FY 2015 that will support the achievement of our strategic goals:
- Improve Patient Safety
- Improve Health Care Through Meaningful Use of Health Information Technology
- Improve the Quality of Early Childhood Education
- Reduce Combustible Tobacco Use
- Reduce Foodborne Illness in the Population
HHS performance initiatives, including APGs, continue to influence plans and policies as demonstrated in the Department’s Plan, which guides our efforts into the future.
 HHS continues to engage with individuals across the federal performance management community to implement best practices and refine our processes. These refinements and lessons learned have also influenced future plans and priorities. Refer to the “Looking Ahead to 2016” section for further details. HHS will actively monitor progress and work towards achieving our goals through quarterly data-driven reviews and other mechanisms. The most recent data, accomplishments, and future actions on HHS APGs, as well as information on previous APG cycles, can be found on Performance.gov. The website provides information on the measures and milestones used by HHS to monitor progress toward these goals.
In addition to the APGs and strategic reviews, HHS reported data on 137 key performance measures in its FY 2015 HHS Annual Performance Plan and Report. These measures represent important issue areas being addressed by the health care and human services communities. The performance measures present a powerful tool to improve HHS operations and help to advance an effective, efficient, and productive government. HHS regularly collects and analyzes performance data to inform decisions. While HHS does not yet have FY 2015 data available for all measures due to the lag associated with data collection and reporting, HHS’s OpDivs and StaffDivs constantly strive to find lower-cost ways to achieve positive impacts in addition to sustaining and fostering the replication of effective and efficient government programs. For more information on results from FY 2015 and earlier, consult the HHS Annual Performance Plan and Report, released annually in February along with the President’s Budget.
Performance Results
 The performance results in this section represent key measures and performance highlights demonstrating progress toward each HHS strategic goal.
The accomplishments and performance trends, including progress on HHS Priority Goals, underscore HHS’s dedication to sustained performance improvement, and emphasis on working to meet the Department’s four strategic goals. Targets presented within the graphs represent performance expectations based on a number of factors and may not exceed the previous years’ results, although they may represent an improvement over previous years’ targets. The results marked with an asterisk (*) within each strategic goal indicate targets that were met or exceeded for the applicable period. Some results were not available at the time of this report due to the lag associated with data collection requirements. The target is displayed to show planned progress. In February 2016, additional performance measures and trends will be available in related reports on HHS/About HHS/Budget & Performance.
Strategic Goal One: Strengthen Health Care
On March 23, 2010, President Obama signed the Affordable Care Act into law, transforming and modernizing the American health care system. HHS continues to drive the effort to strengthen and modernize health care to improve patient outcomes. Through its programs, HHS also promotes efficiency and accountability, ensures patient safety, encourages shared responsibility, and works toward high-value health care. In addition to addressing these responsibilities, HHS is improving access to culturally competent, quality health care for uninsured, underserved, and vulnerable populations.
Standardized Infection Ratio of Catheter-Associated Urinary Tract Infections. HHS’s efforts to reduce Healthcare-Associated Infections (HAIs), which would improve patient safety and health care quality, are reflected in the “Improve Patient Safety” APG. These infections can lead to significant morbidity and mortality, with tens of thousands of lives lost each year. During the FY 2014 – FY 2015 APG period, HHS efforts focused on catheter-associated urinary tract infections (CAUTI).
Leveraging the combined programmatic efforts within HHS, including AHRQ, CDC, CMS, and OASH, the “Improve Patient Safety” APG is working to reduce CAUTI by 10 percent in hospitals nationwide by the end of FY 2015. This is measured over the FY 2013 Standardized Infection Ratio (SIR) of 1.03. The most current National Healthcare Safety Network (NHSN) data for the time period through September 30, 2014 shows a CAUTI SIR of 0.98. This is a reduction from the previous cycle’s CAUTI SIR of 1.06. Knowledge gained during this period has led to better data tracking and monitoring as well as new approaches in the Intensive Care Units (ICUs) based on identified potential barriers. Analysis of the CAUTI data continues to reveal marked difference in reductions between ICUs and non-ICUs. ICUs have significantly higher SIRs, higher number of catheter-days, and show less reductions in these indicators of progress than in the non-ICU setting. Lessons learned were also used to focus HHS efforts, including targeting the hospitals with the highest excess number of CAUTIs. HHS program efforts that help health care partners achieve this goal include AHRQ’s Comprehensive Unit-based Safety Program (CUSP), CDC’s development and maintenance of the NHSN, CMS’s Quality Improvement Organizations and Partnership for Patients initiative, and strategic direction and support from OASH, including the National Action Plan to Prevent HAIs.
APG - Improve Patient Safety
Standardized Infection Ratio of Catheter-Associated Urinary Tract Infections
(* result met or exceeded target) 1

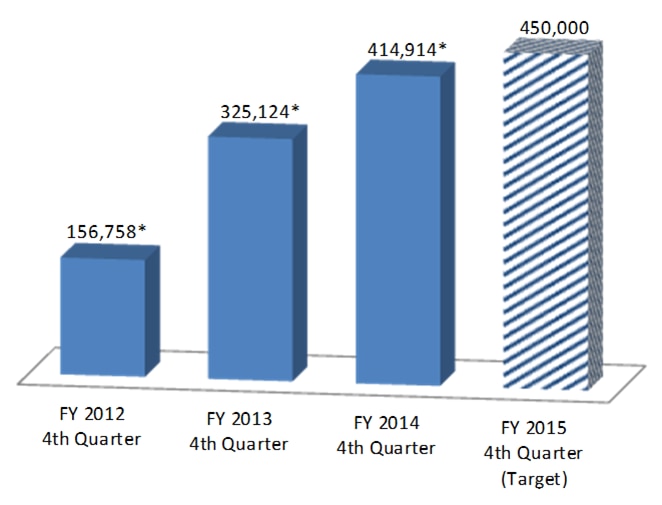
 Incentive Payments from CMS Medicare and Medicaid Electronic Health Records Incentive Programs. At the heart of HHS’s strategy to strengthen and modernize health care is the use of data to improve health care quality, reduce unnecessary health care costs, decrease paperwork, expand access to affordable care, improve population health, and support reformed payment structures. The nation’s health information technology infrastructure enables the flow of information to power these critical efforts that can help facilitate the types of fundamental changes in access and health care delivery set forth in the American Recovery and Reinvestment Act of 2009. A key step in this strategy is to provide incentive payments to eligible providers serving Medicare and Medicaid beneficiaries who adopt and meaningfully use certified electronic health records (EHR) technology. The “Improvement of Health Care through Meaningful Use of Health Information Technology” continued as an APG for the FY 2014 – FY 2015 period, with a goal of 450,000 incentive payments by the end of 2015. As of the third quarter of 2015, this goal has already been surpassed, with 471,516 incentive payments made. Note that while information is collected quarterly, targets are generally set annually.
APG – Improve Health Care through Meaningful Use of Health Information Technology
Number of Eligible Providers who Receive an Incentive Payment from
CMS Medicare and Medicaid Electronic Health Records Incentive Programs
(* result met or exceeded target) 2
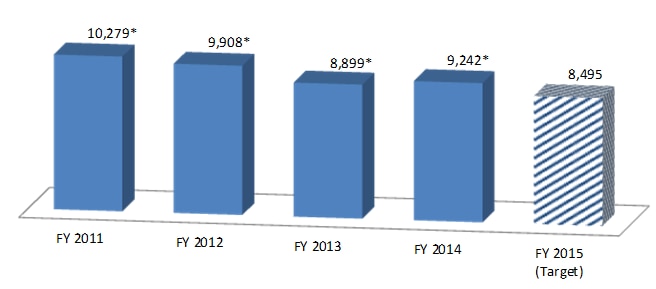
Field Strength of the National Health Service Corps. The National Health Service Corps (NHSC) addresses the nationwide shortage of health care providers by providing recruitment and retention incentives in the form of scholarship and loan repayment support to health professionals committed to a career in primary care and service to underserved communities. More than 45,000 primary care medical, dental, mental, and behavioral health professionals have served in the NHSC since its inception. The field strength indicates the number of providers fulfilling active service obligations with the NHSC in underserved areas in exchange for scholarship or loan repayment support. In FY 2014, the NHSC field strength was 9,242, exceeding the target of 7,522. The annual field strength is dependent upon funding levels and programmatic policy decisions that allocate funding between the scholarship and loan repayment programs. NHSC loan repayors are immediately counted in the annual field strength, while NHSC scholars are not counted until completion of training. Future designated mandatory funding will further bolster the NHSC field strength to expand access to primary care services in underserved communities and vulnerable populations in high need urban and rural communities across the country.
Field Strength of the NHSC, as Measured by the Number of Providers Fulfilling Active Service Obligations in
Exchange for Scholarship and Loan Repayment Agreements
(* result met or exceeded target) 2
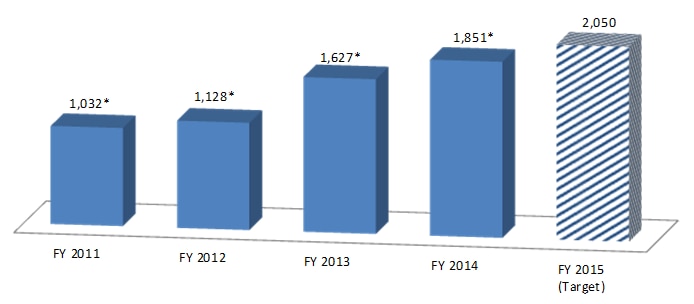
Users of AHRQ-Supported Research Tools. As an indicator of the number of health care organizations using AHRQ-supported tools to improve patient safety, AHRQ relies in part on the Hospital Survey of Patient Safety (HSOPS). Some organizations that use the survey voluntarily submit their data to a comparative database for aggregation. In FY 2014, 1,851 hospitals indicated in this survey that they use AHRQ-supported tools to improve patient safety, exceeding the target as the program has consistently for years. Interest in other AHRQ tools and resources has also remained strong, as evidenced by on-going participation in informational webinars, electronic downloads, and orders placed for various products.
Number of Users of Research Using AHRQ-Supported Research Tools to Improve Patient Safety Culture
(* result met or exceeded target) 2
Accountable Care Organizations (ACOs) are groups of doctors, hospitals, and other health care providers who come together voluntarily to provide coordinated high quality care to Medicare patients. This coordinated care helps ensure that patients, especially the chronically ill, get the right care at the right time, with the goal of avoiding unnecessary duplication of services and preventing medical errors. Leveraging the innovative model of ACOs is a key part of promoting health care cost savings through the Affordable Care Act. As part of the delivery system reform process, we aim to increase the number of Medicare beneficiaries who aligned with the ACOs and the number of physicians participating in the ACOs. While data collection on a number of ACO-related measures began only in 2013, early results are encouraging. In calendar year 2013, the baseline year, over 4 million Medicare beneficiaries aligned to ACOs, with the expectation of increasing alignment to more than 7 million beneficiaries during the 2015 calendar year. The number of physicians participating in an ACO in FY 2013 was 102,717. For the 2015 calendar year, we expect physician participation to increase by almost 80 percent to 178,000 physicians. Data results for 2014 were not available at the time of publication. Results should be available in the FY 2017 HHS Annual Performance Plan and Report published in February 2016.
Strategic Goal Two: Advance Scientific Knowledge and Innovation
HHS is expanding its scientific understanding of how best to advance health care, public health, human services, and biomedical research and to ensure the availability of safe medical and food products. Chief among these efforts is the identification, implementation, and rigorous evaluation of new approaches in science, health care, public health, and human services. These efforts encourage efficiency, effectiveness, sustainability, and sharing or translating that knowledge into better products and services.
In FY 2014, electronic media reach of the CDC Vital Signs monthly report was over 3.5 million potential viewings, exceeding its year-end target goal of 2.9 million potential viewings. During FY 2014, CDC published over 240 Morbidity and Mortality Weekly Report (MMWR) publications, and increased total electronic media reach by 23 percent since FY 2012 from 18.1 million to 22.2 million during FY 2014. In FY 2015, CDC expects an increase in electronic media reach of CDC Vital Signs and MMWR weekly and serial publications.
 Since 2013, SAMHSA has leveraged mobile technology to increase the reach of its resources by launching multiple mobile applications (apps). Each new app has had a greater reach than the ones that preceded it. First, to further support behavioral health first responders, SAMHSA developed and launched the behavioral health disaster mobile app that allows behavioral health first responders to zero in on the exact location to respond to a disaster and easily access and share behavioral health resources, updated in real-time, for those most in need at a disaster site. In August of 2014, SAMHSA released “KnowBullying.” “KnowBullying” empowers parents, caregivers, and educators with the tools they need to start a conversation about bullying with their children. “KnowBullying,” a 2014 recipient of the Bronze Award in the Mobile category from the Web Health Awards, describes strategies to prevent bullying and explains how to recognize warning signs that a child is bullying, witnessing bullying, or being bullied. Then, in February of 2015, SAMHSA launched the “Suicide Safe” app for primary care and behavioral health providers. This app is designed to help providers address suicide risk and integrate suicide prevention strategies in patient care. “Suicide Safe” has been downloaded over 23,500 times since its launch, and received the 2015 Silver Digital Health Information Award. In the future, SAMHSA will continue to innovate in these new platforms by launching additional mobile apps to address other important behavioral health topics.
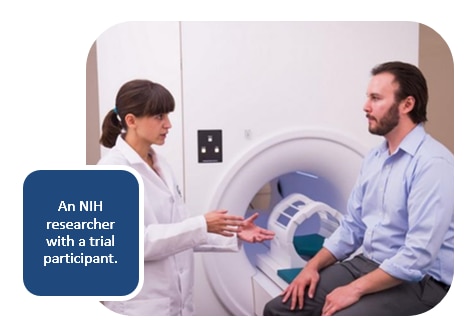 Individuals who have experienced a traumatic brain injury (TBI) are more likely to experience ongoing neurological and psychological symptoms. Currently, there is no way to identify those who are at greatest risk for developing these chronic symptoms. However, recent NIH research suggests that a protein known as tau may be responsible for the long-term complications from TBI. Using a new, ultra-sensitive technology, a team of researchers led by the NIH was able to measure levels of tau in the blood months and years after military personnel had experienced TBI. Elevated levels of tau are associated with chronic neurological symptoms, including post-concussive disorder, during which an individual has symptoms such as headache and dizziness in the weeks and months after injury. These chronic neurological symptoms have been linked to progressive brain degeneration that leads to dementia following repetitive TBIs, independent of other factors such as depression and post-traumatic stress disorder. With further study, these findings may provide a framework for identifying patients who are most at risk for experiencing chronic symptoms related to TBI. Knowledge of the relationship of tau accumulation to chronic complications related to TBI may also someday provide a therapeutic target for treating the causes of neurodegenerative and psychological conditions that can result from these types of injury.
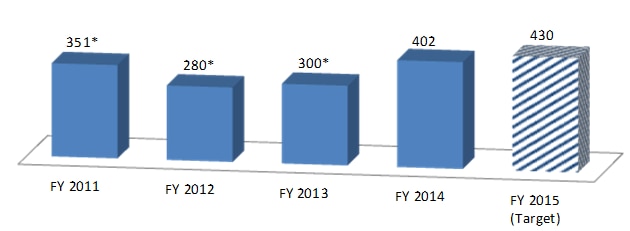
International Field Epidemiology Training Programs. Since 1980, CDC has developed International Field Epidemiology Training Programs (FETP) serving 60 countries that have graduated over 3,600 epidemiologists. Through FETPs, CDC helps establish a network of disease detectives around the globe that are the first line of defense in detecting and responding to outbreaks in their respective countries as well as neighboring countries. From the most current data available in FY 2014, FETP graduates and residents led 424 outbreak investigations, and CDC’s Global Disease Detection Centers responded to 319 disease outbreaks. On average, over 80 percent of FETP graduates work within their Ministry of Health after graduation and many assume key leadership positions, such as the National Director of Tuberculosis program and National Director of Chronic Disease program in the Dominican Republic. Although short of its target of 430 new residents, CDC brought on more new FETP residents in FY 2014 than in any previous year, strengthening global health ministries’ ability to detect and respond to outbreaks.
Capacity of Epidemiology and Laboratory within Global Health Ministries through FETP
as measured by the Number of New Residents
(* result met or exceeded target) 22
Strategic Goal Three: Advance the Health, Safety, and Well-Being of the American People
HHS strives to promote the health, economic, and social well-being of children, people with disabilities, and older adults while improving wellness for all. To meet this goal, the Department is employing evidence-based strategies to strengthen families and to improve outcomes for children, adults, and communities. A focus on prevention underlies each objective and strategy associated with this goal.
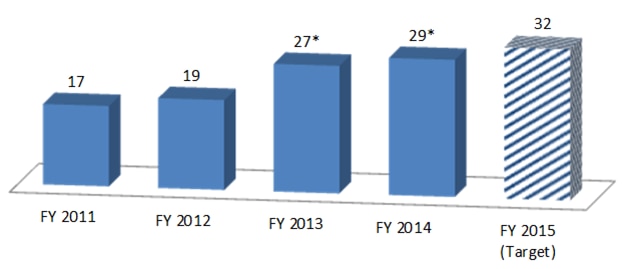
Quality Rating and Improvement Systems with High - Quality Benchmarks. The “Improve the Quality of Early Childhood Education” APG calls for actions to improve the quality of programs for children of low-income families, namely Head Start and Child Care. For the Child Care program, the aim is to increase the number of states with Quality Rating and Improvement Systems (QRIS) that meet the seven high-quality benchmarks for child care and other early childhood programs developed by HHS. QRIS is a mechanism used to improve the quality of child care available in communities and to increase parents’ knowledge and understanding of available child care options. Through FY 2014, 29 states had a QRIS that met high-quality benchmarks, meeting the APG target. States made several changes to their QRIS, such as opening eligibility to family child care providers, expanding from a pilot program to statewide program, and implementing new consumer education efforts.
APG – Improve the Quality of Early Childhood Education
Number of States Implementing QRIS that Meet the High-Quality Benchmarks
(* result met or exceeded target) 2
HERE HERE
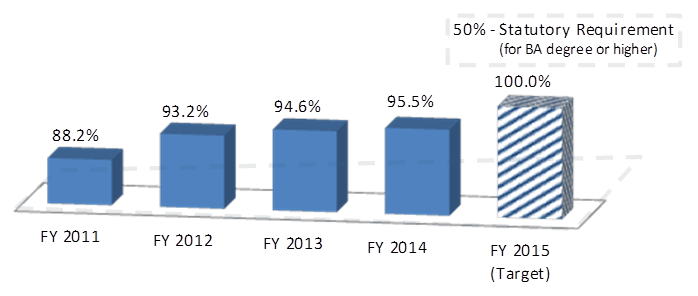
Head Start Teachers with Degrees in Early Childhood Education. Head Start has shown a steady increase in the number of Head Start teachers with an Associate of Arts (AA), Bachelor of Arts (BA), or other advanced degree in early childhood education, supported by plans to improve the qualifications of staff. Based on the most recent data available from FY 2014, 95.5 percent of Head Start teachers (41,977 out of 43,946) had an AA degree or higher, missing the target of 100 percent but improving significantly since 2008. Additionally, 66 percent of Head Start teachers have a BA degree or higher, far exceeding the statutory requirement of 50 percent.
Percentage of Head Start Teachers with AA, BA, Advanced Degree, or Other Degree
in a Field Related to Early Childhood Education
(* result met or exceeded target) 2
 Combustible Tobacco Consumption (Cigarette Equivalents). Smoking and secondhand smoke kill an estimated 480,000 people in the U.S. each year. For every smoker who dies from a smoking-attributable disease, another 30 live with a serious smoking-related disease. Smoking costs the U.S. $133 billion in medical costs and $156 billion in lost productivity each year. While smoking among adults in the U.S. has decreased significantly from a decade ago, the decline in adult smoking rates has slowed, concurrent with reductions in state investments in tobacco control programs. In addition, the coordinated efforts of the APG to reduce combustible tobacco use have resulted in reductions in adult cigarette consumption, based on FY 2013 results (reported in June 2014). In the FY 2014 – FY 2015 iteration of this APG, HHS focused on a new measure of smoking – annual per capita adult combustible tobacco consumption in the U.S. This new measure focuses on all combustibles, not just cigarettes, as a way to ascertain broader trends in tobacco use among adults. For FY 2014, the annual per capita adult combustible tobacco consumption fell to 1,216, missing the FY 2014 target of 1,212 by only four cigarette equivalents. This represents an approximate 9 percent decrease from the FY 2012 baseline of 1,342.
The data represented below captures the results from the measure used during the previous FY 2012 – FY 2013 APG period.

Rate of Salmonella Enteritidis Illness. Salmonella is the leading known cause of bacterial foodborne illness and death in the U.S. Each year in the U.S., Salmonella causes an estimated 1.2 million illnesses and between 400 and 500 deaths. Salmonella serotype enteritidis (SE), a subtype of Salmonella, is now the most common type of Salmonella in the U.S. and accounts for approximately 20 percent of all salmonella cases in humans; reducing its prevalence supports the HHS Priority Goal to reduce foodborne illness in the population.
The most significant sources of foodborne SE infections are shell eggs (FDA-regulated) and broiler chickens (U.S. Department of Agriculture-regulated). Therefore, reducing SE illness from shell eggs is the most appropriate FDA strategy for reducing illness from SE. Preventing Salmonella infections depends on actions taken by regulatory agencies, the food industry, and consumers to reduce contamination of food, as well as actions taken for detecting and responding to outbreaks.
As part of the shared vision to reduce foodborne illness, FDA has developed a priority goal to reduce Salmonella contamination in shell eggs, and CDC is working with FDA to gather more data to better estimate sources of illness. CDC estimated that, for FY 2007 – FY 2009, 40 percent of domestically acquired, foodborne SE illnesses were from eating shell eggs and 28 percent of total SE illnesses (foodborne, non-foodborne, and international travel-associated) were from shell eggs. CDC completed an evaluation of a “food product” model to estimate annual change in percentage of SE illnesses from shell eggs, but determined that necessary data about contamination of shell eggs were not available. CDC concluded that this model could not be used unless new sources of egg data were obtained. Therefore, as of January 2014, CDC began collecting exposure data from persons with SE infection in FoodNet sites, a network that conducts surveillance for infections diagnosed by laboratory testing of samples from patients. CDC will conduct a preliminary evaluation of this data to assess its quality and determine its usefulness in updating CDC’s exposure model for estimating the proportion of total SE illnesses attributable to shell eggs during 2014 – 2015. While information is collected quarterly, targets are generally set annually. FDA and CDC will continue to discuss sampling strategies for collection, to assure progress on data sharing, and to identify and remove any obstacles in achieving targets.
APG – Reduce Foodborne Illness in the Population
Rate of Salmonella Enteritidis Illness in the Population
(* result met or exceeded target) 2
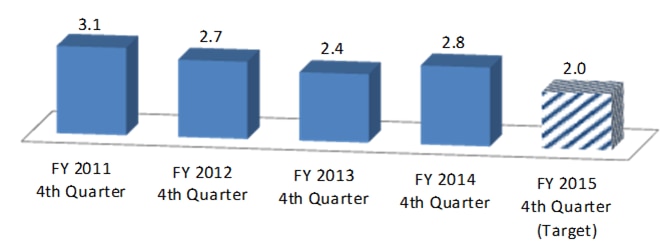
Adults Receiving Homeless Support Services with Positive Follow-Up. One of SAMHSA’s goals in its Strategic Initiative on Recovery Support is to ensure that permanent housing and supportive services are available for individuals with mental and substance use disorders. A way to meet this goal is to ensure the most vulnerable individuals who experience chronic homelessness receive access to sustainable permanent housing, treatment, and recovery support through grant funds and mainstream funding sources. Target populations include veterans and individuals with serious mental illness and/or substance use disorders who experience chronic homelessness. A measure of the effectiveness of this effort is to determine overall physical and emotional health status, from the consumer’s perception of his or her recent functioning. Following the initial 13-percentage-point increase from FY 2008 to FY 2009, the percentage has consistently remained over 60 percent. FY 2014 progress indicated continued sustained performance.
Percentage of Adults Receiving Homeless Support Services
who Report Positive Functioning at 6 Month Follow-up
(* result met or exceeded target) 2
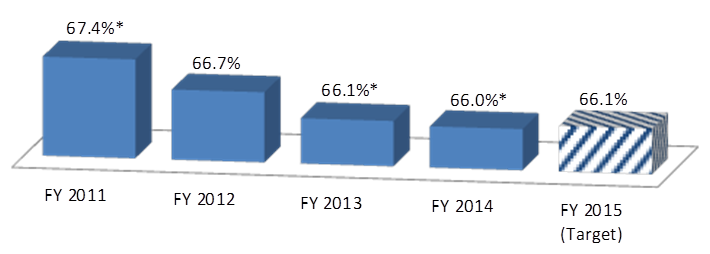
National Family Caregiver Support Program. ACL’s Administration on Aging (AoA) Family Caregiver Support Services enables family members who have a loved one with disabilities or conditions that require assistance to use an array of supportive services, including respite care, information and assistance, support groups, and training. Caregivers are frequently under substantial strain with the responsibilities of caring for their ill relatives while also caring for children or other family members while employed. Since 2008, Family Caregiver Support Services clients have rated services good to excellent consistently above the target level of 90 percent. Nearly 90 percent of respondents reported that the services helped them to be a better caregiver, and nearly three quarters report feeling less stressed due to the services.
Percentage of National Family Caregiver Support Program clients who rate services good to excellent
(* result met or exceeded target) 2

Strategic Goal Four: Ensure Efficiency, Transparency, Accountability, and Effectiveness of HHS Programs
As the largest grant-awarding agency in the federal government and the nation’s largest health insurer, HHS places a high priority on ensuring the integrity of its expenditures. HHS manages hundreds of programs in basic and applied science, public health, income support, child development, and health and social services, which award over 75,000 grants annually. The Department has robust processes in place to manage the resources and information employed to support programs and activities.
Medicare and Medicaid Improper Payment Rates. One of CMS’s key goals is to pay Medicare claims properly the first time. This means paying the right amount, to legitimate providers, for covered, reasonable, and necessary services provided to eligible beneficiaries. Paying correctly the first time saves resources required to recover improper payments and ensures the proper expenditure of valuable dollars. The Medicare fee-for-service improper payment rate in FY 2015 was 12.09%. The primary cause of improper payments is lack of documentation to support the services or supplies billed to Medicare, or Insufficient Documentation to Determine errors. The other causes of improper payments are classified as Medical Necessity errors and Administrative or Process Errors Made by Other Party, due to incorrect coding errors. CMS continues to implement corrective actions to address the agency vulnerabilities.
Percentage of Improper Payments Made Under the Medicare Fee-for-Service Program
(* result met or exceeded target)

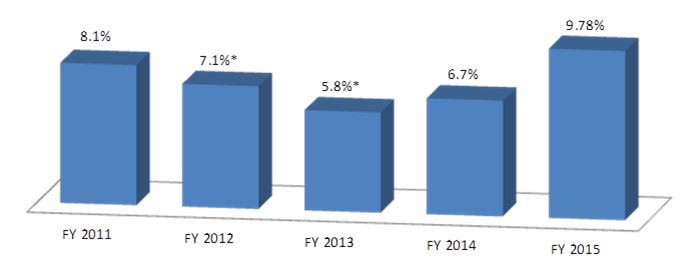
Since roughly one third of the states are measured each year to calculate the Medicaid improper payment rates, these measures are calculated as a rolling rate that includes the reporting year and the previous two years. The Medicaid improper payment rate in FY 2015 was 9.78 percent. The increase was due to state difficulties bringing systems into compliance with new requirements for: (1) all referring or ordering providers to be enrolled in Medicaid, (2) states to screen providers under a risk-based screening process prior to enrollment, and (3) the inclusion of the attending provider National Provider Identifier (NPI) on all electronically filed institutional claims. While these requirements will ultimately strengthen the integrity of the program, they require systems changes and, therefore, many states had not fully implemented these new requirements. CMS works closely with states to develop state-specific corrective action plans that address improper payments and describe systems updates to bring states into compliance. In an attempt to reduce the national Medicaid error rates, states are required to develop and submit state-specific corrective action plans.
Estimate of the Payment Error Rate in the Medicaid Program
(* result met or exceeded target)
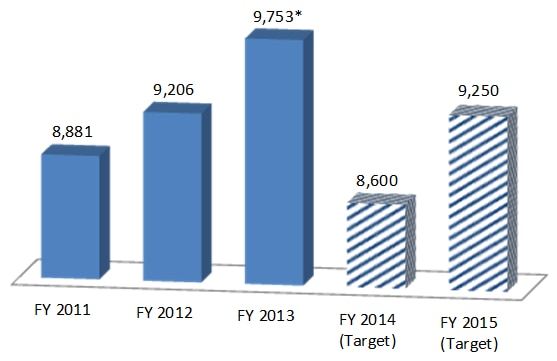
Clients Served by Home and Community-Based Services. A key factor contributing to ACL’s program success is access to Home and Community-based Services. Between FY 2008 and FY 2013, performance has improved by 17.5 percent, without benefit of adjustment for inflation. In FY 2013, the Aging Services Network served 9,753 clients per million dollars of Older Americans Act funding, exceeding the target of 8,700 clients per million dollars. Performance trended upward and performance targets were consistently attained. This reflects the success of ongoing initiatives to improve program management and expand options for home and community-based care. Aging and Disability Resource Centers, along with increased commitments and partnerships at the state and local levels, have all had positive impacts on program efficiency. Between FY 2014 and FY 2017, however, the targeted number of clients served is expected to vary as delayed effects of sequestration may occur.
Number of Clients Served by Home and Community-Based Services, including Nutrition and Caregiver Services, per
Million Dollars of Title III Older Americans Act Funding
(* result met or exceeded target) 2
 ACF’s Head Start program works to ensure that the maximum number of children are served and that federal funds are used appropriately and efficiently by measuring under-enrollment across programs. Since Head Start grantees range in size from super-grantees with multiple delegate agencies serving up to 20,000 children to individual centers that serve as few as 15 children, a national under-enrollment rate better captures the under-enrollment than the proportion of grantees that meet under-enrollment targets. An un-enrolled space or vacancy in Head Start is defined as a funded space that is vacant for over 30 days.
Though each Head Start program is required to keep a wait list to fill vacancies as they occur, there are a number of reasons that it may be difficult to fill vacancies quickly. Low-income families are often mobile and eligible families on the waiting list may have moved out of the service area. In addition, as state pre-kindergarten programs grow, parents may choose to send their children to those programs. The most recent data available indicate that, during the 2013-2014 program year, Head Start grantees had, on average, not enrolled 0.9 percent (0.88 percent) of the children they were funded to serve, missing the FY 2014 target of 0.6 percent. This represents approximately 8,200 children who could have been served using the Head Start funds appropriated and awarded to grantees.
Decrease in the Under-Enrollment Rate of Head Start Programs;
Increased Number of Children Served Per Dollar
(* result met or exceeded target) 2

Cross-Agency Priority Goals
Cross-Agency Priority goals address the longstanding challenge of tackling horizontal problems across vertical organizational silos. In the 2015 President’s Budget, 15 Cross-Agency Priority Goals were announced – seven mission-oriented and eight management-focused goals with a four year time horizon. Established by the GPRA Modernization Act of 2010, these Cross-Agency Priority Goals are a tool used by federal leadership to accelerate progress on a limited number of Presidential priority areas where implementation requires active collaboration between multiple agencies. HHS contributes to Cross-Agency Priority Goals with other federal agencies in the mission-oriented goals of Science, Technology, Engineering and Mathematics (STEM) Education; and Service Members and Veterans Mental Health. We are also maximizing federal spending through participation in the management-focused goals of Shared Services; Benchmark and Improve Mission-Support Operations; and Customer Service. For more information on HHS’s contributions to Cross-Agency Priority Goals and progress, refer to www.performance.gov.
Systems, Legal Compliance, and Internal Controls
Systems
Financial Systems Environment
HHS’s CFO Community strives to provide effective stewardship of taxpayer funds through transparency and accountability in support of the Department’s mission and programs. The HHS financial systems environment forms the financial and accounting foundation for managing the $1.5 trillion in budgetary resources entrusted to the Department in FY 2015. These resources represent about a quarter of all federal outlays and encompass more grant dollars than all other federal agencies combined.
The robust financial systems environment supports a diverse portfolio of programs and business operations. Its purpose is to: provide complete and accurate financial information for decision-making; improve data integrity; strengthen internal controls; and mitigate risk.
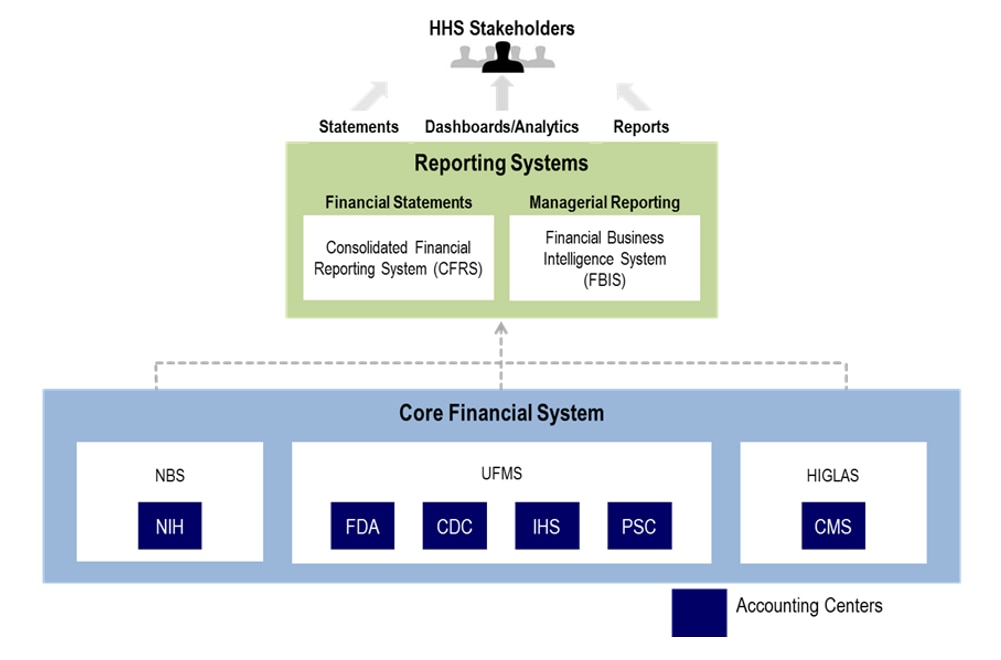
The HHS financial systems environment consists of a core financial system (with three instances) and two Department-wide reporting systems used for financial and managerial reporting that – taken together – satisfy the Department’s financial accounting and reporting needs.
Core Financial System
The core financial system operates on a commercial off-the-shelf (COTS) platform to support data standardization and facilitate Department-wide reporting. Each of the instances operates the same COTS solution.
- The NIH Business System (NBS) serves NIH’s 27 research institutes and accounts for nearly $27.5 billion in annual grants payments.
- The Unified Financial Management System (UFMS) serves 10 OpDivs (including the OS) and 18 StaffDivs across the Department. The following accounting centers utilize UFMS: CDC, FDA, IHS, and PSC. PSC provides shared service accounting support for the rest of the Department.
- The Healthcare Integrated General Ledger Accounting System (HIGLAS) supports CMS. HIGLAS serves 15 Medicare Administrative Contractor organizations, Administrative Program Accounting, and the Center for Consumer Information and Insurance Oversight. It processes an average of five million transactions daily.
Reporting Systems
Reporting components within the HHS financial systems environment consist of two Department-wide applications: Consolidated Financial Reporting System (CFRS) and Financial Business Intelligence System (FBIS). These reporting systems facilitate data reconciliation, financial and managerial reporting, and data analysis.
- CFRS systematically consolidates information from all three instances of the core financial system. It generates Departmental quarterly and year-end consolidated financial statements on a consistent and timely basis while supporting HHS in meeting regulatory reporting requirements.
- FBIS is a financial business intelligence application for managerial reporting. It consolidates information from the core financial system to support strategic and operational reporting requirements. FBIS utilizes a variety of business intelligence techniques to present data for decision-making, including metrics and key performance indicators, dashboards with graphical displays, interactive reports, and ad-hoc reporting.
The illustration below depicts the current environment.
The HHS financial systems environment is required to comply with all relevant federal laws, regulations, and authoritative guidance. In addition, HHS must conform to federal financial systems requirements including:
- Federal Managers’ Financial Integrity Act of 1982
- Chief Financial Officers Act of 1990
- Government Management Reform Act of 1994
- Federal Financial Management Improvement Act of 1996
- Clinger-Cohen Act of 1996
- Federal Information Security Management Act of 2002
- Digital Accountability and Transparency Act (DATA Act) of 2014
- Federal Information Technology Acquisition Reform Act of 2014
· Office of Management and Budget (OMB) directives related to these laws
Financial Systems Environment Improvement Strategy
HHS continues to implement a Department-wide strategy to advance its financial systems environment through the Financial Systems Improvement Program (FSIP) and Financial Business Intelligence Program (FBIP). The goal of the strategy is to improve the effectiveness and efficiency of the Department’s financial management capabilities and to mature the overall financial systems environment. This is a multi-year initiative, and the Department is making significant progress in each of the following key strategic areas.
Governance
- Strategy: In November 2013, the Department established the Financial Management Governance Board (FGB) to address enterprise-wide issues, including those related to financial policies and procedures, financial data, and technology. The FGB’s goals include establishing HHS financial management governance; providing people, processes, and technology to support governance; engaging stakeholders through effective communication and management strategies; and supporting project alignment with federal mandates and priorities.
- Progress: Since its inception, the FGB has met monthly and facilitated executive-level oversight of financial management-related areas. It promotes collaboration among stakeholders from the different disciplines within the financial management community by engaging senior leadership from HHS OpDivs and StaffDivs and across functions such as finance, budget, grants, and information technology (IT). Further, it has become a key forum to address pervasive audit findings related to governance through regular decision-making meetings and clear documentation to support actions taken.
Program Management
- Strategy: To support FSIP, HHS has established a Department-wide program management framework to facilitate effective implementation of FSIP projects and to enhance collaboration across project teams. This includes the Financial Systems Consortium: a body of contractors, federal project managers, and federal contracting officers representing NBS, UFMS, and HIGLAS, that foster communication and implement best practices.
- Progress: Department-wide program management and the Consortium have been critical in coordinating the overall upgrade of the HHS core financial system through communication with HHS leadership and key external stakeholders. Through this framework, project teams have been able to share industry best practices, lessons learned, and risks identified during the upgrade while minimizing overall costs. This has included sharing solutions across system upgrade teams to streamline implementation, as well as coordinating vendor support to resolve software issues. Effective program management has also reduced duplication of effort and costs by identifying potential sharing opportunities and improvements.
Accounting Treatment Manual and Data Standardization
- Strategy: HHS is incrementally developing and implementing a standardized Department-wide Accounting Treatment Manual (ATM) that will improve fiscal transparency and accountability, while enhancing the accuracy of financial reporting.
- Progress: HHS completed its initial development of a Department-wide ATM in April 2014, and recommendations are being implemented concurrently with the system upgrade. The FGB has chartered the Data Standardization Working Group (DSWG), which meets on a quarterly basis, leads ATM changes, and coordinates with the HHS DATA Act Program Management Office (PMO) on DATA Act implementation.
Financial System Upgrade
- Strategy: A critical component of the multi-year FSIP initiative is upgrading the core financial system to the most current version of the COTS software to maintain a secure and reliable financial systems environment. In 2014, HHS began the upgrade in phases, while continuing to support current operations. In addition, a post-upgrade roadmap was developed for implementing future projects and enhancements to further mature the HHS financial systems environment.
- Progress: The NBS and HIGLAS upgrades were completed and put into production during FY 2015. The UFMS upgrade is on-track for completion in FY 2016, as planned. Project teams leveraged the upgrade to identify opportunities for reducing or consolidating many customizations.
Sharing
- Strategy: As a key FSIP component, HHS is actively pursuing multiple initiatives to generate efficiencies and improve effectiveness through implementing shared solutions. The Department has also established a framework for continuously identifying sharing opportunities in its financial systems environment.
- Progress: Examples of sharing opportunities pursued to date include transitioning the financial system to a cloud shared service provider; the use of shared acquisition contracts and consolidation of system operations and maintenance contracts; the development of a Department-wide ATM; and sharing solutions across the HHS financial community. The FGB will assess future opportunities to ensure alignment with financial management and system policies, business processes and operations, and the overall financial system vision and architecture.
Business Intelligence
- Strategy: Leveraging the FBIS platform, HHS is expanding the use of business intelligence with the goals of further enhancing financial management information and reporting, as well as facilitating effective decision-making.
- Progress: Since first deployed in FY 2012, FBIS has been providing operational and business intelligence to users across the HHS finance, budget, grants, and acquisition communities. FBIS provides accurate, consistent, near real-time data from UFMS, and summary data from HIGLAS and NBS, supporting over 1,500 users across the Department, with plans to have over 2,000 users by the end of 2015.
Systems Policy and Compliance
- Strategy: HHS has placed a high-priority on maturing and enhancing its financial systems control environment, strengthening policy, proactively monitoring emerging issues, and ensuring progress towards remediating the Department’s IT Material Weakness. HHS is implementing a policy management program to standardize development, implementation, and monitoring of financial systems policies.
- Progress: HHS addresses the Department’s IT material weakness by analyzing audit findings, identifying root causes, and implementing solutions collaboratively. The FGB chartered an IT Material Weakness Working Group (MWWG), with members from OpDiv Chief Information Officer (CIO), Chief Financial Officer (CFO), and Chief Information Security Officer (CISO) communities. The IT MWWG developed a roadmap to address pervasive issues, recommend comprehensive remediation approaches, and monitor implementation progress. HHS has also initiated projects to develop role-based security controls and identify areas to enhance and automate additional internal controls.
Legal Compliance
Anti-Deficiency Act
The Anti-Deficiency Act (ADA) prohibits federal employees from obligating in excess of an appropriation, or before funds are available, or from accepting voluntary services. As required by the ADA, HHS notifies all appropriate authorities of any ADA violations. ADA reports can be found at GAO's website.
HHS management is taking necessary steps to prevent future violations. With respect to three possible issues, we are working through investigations and further assessment where necessary. We remain fully committed to resolving these matters appropriately and complying with all aspects of the law.
Digital Accountability and Transparency Act of 2014
The DATA Act expands the Federal Funding Accountability and Transparency Act of 2006 to increase accountability and transparency in federal spending, making federal expenditure information more accessible to the public. It directs the federal government to use government-wide data standards for developing and publishing reports, and to make more information, including award-related data, available on USAspending.gov. Among other goals, the DATA Act aims to improve the quality of the information on USAspending.gov, as verified through regular audits of the posted data, and to streamline and simplify reporting requirements through clear data standards. Additionally, the DATA Act accelerated the referral of delinquent debt owed to the federal government to the Treasury’s Offset Program (TOP) after 120 days of delinquency.
HHS is actively implementing requirements of the DATA Act. One of the Department’s initial moves was to establish the DATA Act PMO to facilitate a collaborative Department-wide approach to implementation. We have updated applicable Department financial management policy, reduced our delinquent debt referral window from 180 days to 120 days, and we are auditing the information on USAspending.gov. HHS also revamped our ATM to facilitate data standards throughout the Department.
Improper Payments Information Act of 2002, Improper Payments Elimination and Recovery Act of 2010, and the Improper Payments Elimination and Recovery Improvement Act of 2012
An improper payment occurs when a payment should not have been made, federal funds go to the wrong recipient, the recipient receives an incorrect amount of funds, the recipient uses the funds in an improper manner, or documentation is not available to verify the appropriateness of the payment. The Improper Payments Information Act of 2002 (IPIA), as amended by the Improper Payments Elimination and Recovery Act of 2010 (IPERA), and the Improper Payments Elimination and Recovery Improvement Act of 2012 (IPERIA), requires federal agencies to review their programs and activities, identify programs that may be susceptible to significant improper payments, perform testing of programs considered high risk, and develop and implement corrective action plans for high risk programs. HHS is striving to better detect and prevent improper payments through close review of our programs and activities using sound risk models, statistical estimates, and internal controls. A detailed report of HHS’s improper payment activities and performance is presented in the “Other Information” section of this AFR, under “Improper Payments Information Act Report.”
Patient Protection and Affordable Care Act
The Affordable Care Act implements comprehensive health care reform to make quality health care more affordable and accessible. The Affordable Care Act includes provisions for a patient’s bill of rights, a Health Insurance Marketplace, tax credits for low-income Americans, incentives for high-quality care from physicians, and expansion of the Medicaid program, helping to provide access to affordable health insurance options for all Americans.
The Affordable Care Act also aims to reduce health care fraud, waste and abuse by toughening the sentences for perpetrators of fraud, employing enhanced screening procedures, improving the monitoring of providers, and using predictive modeling technology to target suspect behaviors. These efforts have enabled the government to recover billions of dollars related to improper payments over the last five years. For detailed information on improper payment recovery efforts, see the “Program-Specific Reporting Information” section of the “Improper Payments Information Act Report.”
A key aspect of the Affordable Care Act allows eligible Americans to receive a premium tax credit when purchasing their health insurance coverage through the Health Insurance Marketplace. The amount of the credit can be paid in advance directly to the consumer’s health insurer. Consumers then claim the premium tax credit on their federal tax returns, reconciling the credit allowed with any advance payments made throughout the tax year. HHS coordinates closely with the Internal Revenue Service (IRS) on this process.
HHS has implemented many provisions of the Affordable Care Act. For more information about implementation of the manyAffordable Care Act provisions, visit the “Key Features” page.
Federal Information Technology Acquisition Reform Act
The Federal Information Technology Acquisition Reform Act (FITARA) passed Congress in December 2014 and OMB followed with final implementation guidance in June 2015. FITARA established an enterprise-wide approach to federal IT investments and provides the CIO of CFO Act agencies with greater authority over IT investments, including authoritative oversight of IT budgets and budget execution, as well as IT-related personnel practices and decisions. FITARA also promotes cross-functional partnerships between CIOs and senior agency officials to facilitate the enterprise-wide approach to IT management. HHS’s senior officials, including the CIO, CFO, Chief Human Capital Officer, and Chief Acquisition Officer, have collaborated on a FITARA Implementation Plan, which the Department is coordinating with OMB for approval.
Federal Managers’ Financial Integrity Act of 1982 and Federal Financial Management Improvement Act of 1996
The Federal Managers’ Financial Integrity Act of 1982 (FMFIA) requires federal agencies to annually evaluate and assert on the effectiveness and efficiency of their internal control and financial management systems. Agency heads must annually provide a statement on whether there is reasonable assurance that the agency’s internal controls are achieving their intended objectives and the agency's financial management systems conform to government-wide requirements. Section 2 of FMFIA outlines compliance with internal control requirements, while Section 4 dictates conformance with systems requirements. Additionally, agencies must report on any identified material weaknesses and provide a plan and schedule for correcting the weaknesses.
In September 2014, the U.S. Government Accountability Office (GAO) released an updated edition of its Standards of Internal Control in the Federal Government, effective FY 2016. The document includes several new principles and priorities, including a focus on a framework for Enterprise Risk Management (ERM). OMB is also expected to release in FY 2016 an updated version of Circular A-123, titled Management’s Responsibility for Risk Management and Internal Control. The new Circular will complement GAO’s Standards, and will implement requirements of the FMFIA with the intent to improve accountability in federal programs and increase federal agencies’ consideration of ERM. The Department and its OpDiv and StaffDiv stakeholders will coordinate and collaborate to implement the new requirements.
The Federal Financial Management Improvement Act of 1996 (FFMIA) requires federal agency heads to assess the conformance of their financial management information systems to mandated requirements. FFMIA expanded upon FMFIA by requiring that agencies implement and maintain financial management systems that substantially comply with federal financial management systems requirements, applicable federal accounting standards, and the U.S. Standard General Ledger at the transaction level. Guidance for determining compliance with FFMIA is provided in OMB Circular A-123, Appendix D, Compliance with the FFMIA of 1996.
HHS is fully focused on the requirements of FMFIA and FFMIA through its internal control program and a Department-wide approach to risk management. Based on thorough ongoing internal assessments and FY 2015 audit findings, HHS provides reasonable assurance that controls are operating effectively. For further information, see the “Management Assurances” section. We are actively engaged with our OpDivs to correct the identified weakness, supported by a renewed emphasis on a stringent corrective action process focused on addressing the true root cause of deficiencies along with active management oversight. More information on Department’s internal control efforts and the HHS Statement of Assurance follows.

Internal Control
FMFIA requires agency heads to annually evaluate and report on the internal control and financial systems that protect the integrity of federal programs. This evaluation aims to provide reasonable assurance that internal controls are achieving the objectives of effective and efficient operations, reliable financial reporting, and compliance with applicable laws and regulations. The safeguarding of assets is a subset of these objectives. Since FY 2006, HHS has performed rigorous evaluations of its internal controls in compliance with OMB Circular A-123 , Management’s Responsibility for Internal Control.
 HHS management is directly responsible for establishing and maintaining effective internal controls in their respective areas of responsibility. As part of this responsibility, management regularly evaluates internal control and HHS executive leadership provides annual assurance statements reporting on the effectiveness of controls at meeting objectives. The HHS Risk Management and Financial Oversight Board (RMFOB) evaluates the OpDivs’ management assurances and recommends a Department assurance for the Secretary’s consideration. The Secretary’s annual Statement of Assurance follows.
HHS aims to strengthen its internal control assessment and reporting process to more effectively identify key risks, develop effective risk responses, and implement timely corrective actions. The HHS FY 2015 OMB Circular A-123 assessment and the financial statement audit reported one material weakness in Information System Controls and Security, which also constitutes a non-conformance under Section 4 of FMFIA. Additionally, HHS recognizes one material noncompliance with IPIA regarding Error Rate Measurement. These material findings were also reported in FY 2014.
Maintaining integrity and accountability in all programs and operations is critical to HHS’s mission and demonstrates responsible stewardship over assets and resources. It also promotes responsible leadership, ensures the effective delivery of high quality services to the American people, and maximizes desired program outcomes.
MANAGEMENT ASSURANCES
Statement of Assurance
The Department of Health and Human Services’ (HHS or the Department) management is responsible for establishing and maintaining effective internal control and financial management systems that meet the objectives of the Federal Managers’ Financial Integrity Act (FMFIA) and Office of Management and Budget (OMB) Circular A‑123, Management’s Responsibility for Internal Control. These objectives are to ensure (1) effective and efficient operations; (2) compliance with applicable laws and regulations; and (3) reliable financial reporting. The safeguarding of assets is a subset of these objectives.
As required by OMB Circular A-123, HHS has evaluated its internal control and financial management systems to determine if these objectives are being met. The Department provides reasonable assurance that internal controls were operating effectively as of September 30, 2015, with the exception of one material weakness related to Information System Controls and Security (which also constitutes a system non-conformance) and one material noncompliance with the Improper Payments Information Act (IPIA) related to Error Rate Measurement.
Remediation for the material weakness is underway, as described in the “Corrective Action Plans for Material Deficiencies” section. Remediation for the material noncompliance relies on a modification to legislation to require states to participate in an improper payment rate measurement.
Internal Control over Financial Reporting (ICOFR)
HHS conducted its assessment of the effectiveness of ICOFR, which includes safeguarding assets and compliance with applicable laws and regulations, in accordance with the requirements of OMB Circular A-123, Appendix A. Other than the one material weakness mentioned above, the Department provides reasonable assurance that internal controls over financial reporting were operating effectively as of June 30, 2015.
Internal Control over Operations and Compliance
HHS conducted its assessment of internal control over the effectiveness and efficiency of operations and compliance with applicable laws and regulations in accordance with OMB Circular A-123. Other than the one material weakness and the one material noncompliance mentioned above, the Department provides reasonable assurance that internal control over operations and compliance with applicable laws and regulations was operating effectively as of September 30, 2015.
Federal Financial Management Improvement Act of 1996 (FFMIA)
FFMIA requires agencies to implement and maintain financial management systems that substantially comply with federal financial management system requirements, federal accounting standards, and the United States Standard General Ledger at the transaction level. HHS conducted its evaluation of financial management systems for compliance with FFMIA in accordance with OMB Circular A-123, Appendix D. As mentioned above, HHS identified one material weakness, which also constitutes a system non-conformance under FMFIA, Section 4, and as a result determined that its financial management systems neither fully comply with the FFMIA, nor fully conform to the objectives of FMFIA, Section 4. The Department is nearing completion of a phased, enterprise-wide financial system upgrade that will address many factors contributing to the material weakness, with stabilization expected in Fiscal Year (FY) 2016.
HHS will continue to ensure accountability and transparency over the management of taxpayer dollars, and strive for the continuing progress and enhancement of its internal control and financial management programs.
/Sylvia M. Burwell/
Sylvia M. Burwell
Secretary
November 13, 2015
Summary of Material Weaknesses
| Control Areas |
FMFIA Section 2 | FMFIA Section 4 | ||
|---|---|---|---|---|
| Financial Reporting (As of 6/30/2015) |
Operations (As of 9/30/2015) |
Compliance (As of 9/30/2015) |
System Non-Conformance (As of 9/30/2015) |
|
| 1. Information System Controls and Security | 1 | 1 | 0 | 1 |
| 2. Error Rate Measurement | 0 | 0 | 1 | 0 |
1. Information System Controls and Security
HHS acknowledges a material weakness related to Information System Controls and Security. This material weakness includes general and application controls specifically related to segregation of duties, access controls, and configuration management, as well as other information system security weaknesses that were identified through the annual Federal Information Systems Control Audit Manual, Federal Information Security Management Act (FISMA), and other internal management reviews. While no single financial management system had a material weakness, the pervasive nature of the deficiencies throughout the Department leads management to conclude that these aggregate deficiencies warrant classification as a material weakness under Section 2 of FMFIA and a non-conformance under Section 4 of FMFIA. While the Department has made progress in the remediation of this material weakness, our financial management systems are not yet in substantial compliance with FFMIA and its associated regulatory guidelines.
2. Error Rate Measurement
HHS did not identify any material weaknesses in our internal control over compliance with applicable laws and regulations; however, HHS reports a statutory limitation relating to the Temporary Assistance for Needy Families (TANF) program that results in one material noncompliance with IPIA. The TANF program is not reporting an error rate for FY 2015, as required by IPIA, because statutory limitations currently prohibit HHS from requiring states to provide information needed for determining a TANF improper payment measurement.
Corrective Action Plans for Material Deficiencies
1. Information System Controls and Security
HHS has placed a high priority on remediating the Information System Controls and Security material weakness and maturing its financial systems control environment through strengthening policy, proactively monitoring emerging issues, and ensuring progress toward correcting deficiencies contributing to the material weakness. A Department-wide IT Material Weakness Working Group (MWWG) was established in FY 2015 with members from the Chief Financial Officer, Chief Information Officer, and Chief Information Security Officer communities to collaboratively identify challenges, conduct root cause analyses, and jointly implement comprehensive solutions. In FY 2015, the IT MWWG developed a roadmap for improving the financial systems safeguards related to segregation of duties, access controls, configuration management, and FISMA weaknesses that contribute to the Information System Controls and Security material weakness.
Additional efforts are required beyond FY 2015 to address the range of challenges stemming from HHS’s Information System Controls and Security material weakness and system non-conformance. In FY 2016, HHS will continue its collaborative efforts to identify high risk areas within the HHS financial systems environment, develop remediation plans, and monitor corrective action implementation to meet the Department’s objectives. HHS will continue to report remediation progress to the Risk Management and Financial Oversight Board and maintain accountability and commitment to strengthen the HHS financial systems environment.
2. Error Rate Measurement
Current statutory limitations restrict corrective actions HHS can take to develop an error rate for TANF. HHS plans to encourage Congress to consider statutory modifications that would allow for reliable error rate measurement when legislation is considered to reauthorize TANF.
Looking Ahead to 2016
HHS is the U.S. government’s principal agency for protecting the health of all Americans, providing essential human services, and promoting economic and social well-being for individuals, families, and communities, including seniors and individuals with disabilities. Guided by the HHS Strategic Plan, 2016 will be crucial in supporting continuing Health Insurance Marketplace operations as well as many other efforts in a number of exciting and challenging areas.
Strengthen Health Care
 HHS is responsible for implementing many of the provisions included in the Affordable Care Act, which makes health insurance coverage more secure and reliable for Americans, makes coverage more affordable and accessible for families and small business owners, and helps bring down health care costs. The Affordable Care Act also expands consumer choice, supports informed decision making, and increases health insurance coverage for low-income populations, partly through the expansion of Medicaid eligibility and the advent of the Health Insurance Marketplace, which launched on October 1, 2013. Medicaid enrollment has grown from 57.8 million enrollees in September 2013 to 70.0 million enrollees in January 2015, which represents a 21 percent growth in enrollment.
As of June 30, 2015, about 9.9 million Americans had effectuated Health Insurance Marketplace coverage through the Health Insurance Marketplaces established by the Affordable Care Act. The Department is also working to strengthen the ties between Medicare payments and value as opposed to volume, a shift made possible by the Affordable Care Act and the Medicare Access and CHIP Reauthorization Act (MACRA).
In an effort to improve access to health care, the Department continues to make significant investments in new access points and expanded services, including funding for substance abuse treatment and care, which is critical to combatting the opioid epidemic affecting our country, especially in rural communities.
Advance Scientific Knowledge and Innovation
HHS is working to advance scientific knowledge and innovation to prevent, diagnose, and treat diseases and disorders as well as address emerging health threats, and sustain a vital and cutting edge workforce and scientific infrastructure. Future HHS plans include accelerating the development of opportunities for the prevention and treatment of substance use and abuse, researching Alzheimer’s disease and related dementias, as well as human immunodeficiency virus (HIV) and reversing the national epidemic of obesity and diabetes. Research will also address health disparities, multiple chronic conditions, and cardiovascular disease, all critical health priorities facing America. In order to build on past successes, the Department will encourage initiatives focused on the President’s priority areas of Precision Medicine as well as the Brain Research through Advancing Innovative Neurotechnologies (BRAIN) Initiative. The Department will also encourage advancements associated with the Cures Acceleration Network, the National Library of Medicine, and expanding the number of competing research project grants.
Advance the Health, Safety, and Well-Being of the American People
HHS’s focus will continue aligning with the Surgeon General’s National Prevention Strategy, which seeks to create environments that promote healthy behaviors such as preventing and reducing tobacco use, and implementing a 21st century food safety system to reduce foodborne illness in the population. HHS will also help Americans achieve and maintain healthy weight through school-based, workplace-based, and community-based strategies.
 HHS plays a crucial role in global health security. Through the Biomedical Advanced Research and Development Authority (BARDA), the Department provides an integrated, systematic approach to the advanced development and purchase of necessary vaccines, drugs, therapies, and diagnostic tools. BARDA, along with HHS and industry partners, is developing, manufacturing, and storing medical countermeasures for chemical, radiological, biological, and nuclear threats; pandemic influenza; and emerging infectious threats, and is also working to provide new options to treat antibiotic-resistant infections. The Department will also continue its effort to promote global well-being and health diplomacy, as well as create a nimble system better able to respond to unanticipated demands.
 HHS plans to continue investing in efforts to prevent and manage chronic diseases and conditions, enhancing clinical efforts including childhood and adult immunizations, threat detection and response, and supporting behavioral and primary health integration. These efforts will support overall public health as well as protect Americans’ health and safety during emergencies, and foster resilience in response to emergencies. Health at all ages is a priority for the Department. Continued partnering between HHS and state, local, tribal, urban Indian, and other service providers will sustain an essential safety net of services that protect children and youth, promote their emotional health and resilience in the face of adversity, and ensure their healthy development from birth through transition to adulthood. Health and early intervention services ensure children get off to a good start from infancy. To support this, HHS will maintain efforts to improve the quality of early childhood education for all children, and other efforts that will put children and youth on the path to successful futures, such as improving access to care, treatment, and services for children and youth exposed to traumatic events. Furthermore, by implementing evidence-based strategies in home visiting, foster care, and teen pregnancy prevention, HHS will ensure that this population is given the chance to succeed in adulthood and can contribute to America’s success. Community living for older adults and people with disabilities will continue to be a focus area as the U.S. population over the age of 65 is projected to increase by 29 percent between 2012 and 2020.
Ensure Efficiency, Transparency, Accountability, and Effectiveness of HHS Programs
 As we near the end of this Administration, HHS leadership is committed to leaving the Department in a strong position to continue its vital work. To do this, HHS will stay committed to developing effective systems, workforce, and infrastructure that can address complicated and emerging challenges. These efforts will allow HHS to continue toward its goal of improved health and well-being among Americans. Specifically, HHS will continue its evaluation efforts, including program integrity reviews that ensure compliance with federal program integrity regulations and identify areas to improve efficiency and effectiveness. Additionally, HHS is entrusted with a wealth of sensitive data, including personally identifiable information, financial and patient data, and biodefense research; ensuring its security is a high priority. As cybersecurity threats are constantly evolving and becoming more sophisticated, the Department will need to continually hone the skills necessary to monitor threats and quickly respond to a changing environment.
While continuing the spirit of collaboration from stakeholders throughout the Department, HHS will pursue seven APGs for FY 2016 – FY 2017. These efforts support significant improvements in near-term outcomes and advanced progress toward longer-term, outcome-focused strategic objectives. These APGs include efforts around the following areas:
- Early Childhood Education
- Combustible Tobacco Use
- Foodborne Illness
- Health Care Payment Reform
- Combating Antibiotic-Resistant Bacteria
- Opioid Abuse
- Serious Mental Illness
More information on the FY 2016 – 2017 APGs is available on Performance.gov.

Analysis of Financial Statements and Stewardship Information
The financial statements, which include the Consolidated Balance Sheets, Consolidated Statement of Net Cost, Consolidated Statement of Changes in Net Position, Combined Statement of Budgetary Resources, Statement of Social Insurance, and the Statement of Changes in Social Insurance Amounts, as well as the Notes discussed in this section, are prepared in conformity with U.S. generally accepted accounting principles (GAAP) established by the Federal Accounting Standards Advisory Board (FASAB). These financial statements and Notes are audited by the independent accounting firm of Ernst & Young LLP, under the direction of the Office of Inspector General. The CFO Act requires the preparation and audit of these statements, which are part of our efforts for continuous improvement of financial management.
Accurate, timely, and reliable financial information is necessary for making sound decisions, assessing performance, and allocating resources. The “Financial Section” of this report presents our audited financial statements and Notes. The analysis within this section is a summary of those audited statements and highlights certain significant balances and variances; supplemented by graphic presentations and explanations which help clarify their relevance to HHS.
Through OS and its 11 OpDivs, HHS administers over 300 programs for the benefit of the American people. CMS is the largest OpDiv, which oversees a significant share of the Department’s financial activity. Fluctuations in the financial statements for FY 2015 over FY 2014 are primarily the result of program growth and changes at CMS. Year-over-year summary changes for each HHS financial statement are discussed in the following sections. Greater detail can be found in the “Notes to the Principal Financial Statements” in the “Financial Section” of this report.
Balance Sheets
The table below summarizes current and prior year information concerning components of our financial condition as of September 30 each year. The components of the Consolidated Balance Sheets are the assets under HHS authority, the responsibilities owed by the Department, and the difference between them, or net position.

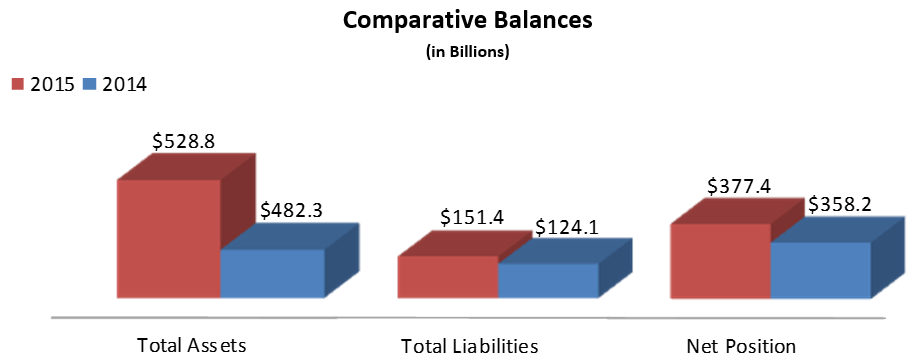
Assets
Assets represent the value of what we own and manage. Our total assets were $528.8 billion on September 30, 2015. This amount represents an increase of $46.5 billion or approximately 10 percent greater than last year’s assets. We have experienced a slight change in the overall composition of our assets in FY 2015 compared to FY 2014. The Fund Balance with Treasury (FBwT) and Net Investments together currently comprise 93 percent of our total assets, versus 95 percent in FY 2014.
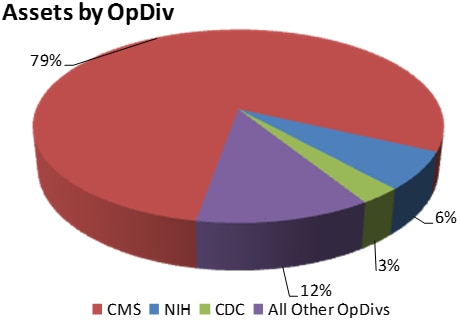
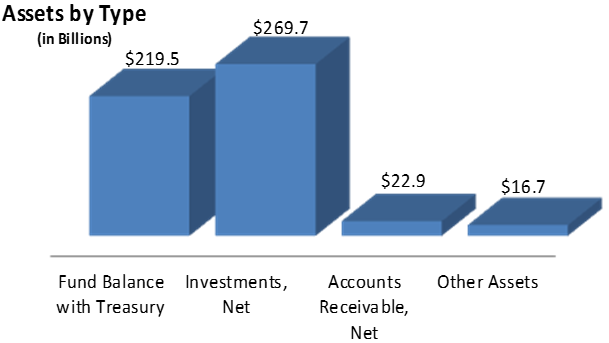
The majority of the increase in FBwT is attributable to a $36.2 billion increase in CMS’s FBwT related primarily to Supplementary Medical Insurance (SMI), CHIP, and Medicaid increases of $25.0, $5.6, and $5.1 billion; respectively. Other notable changes in the FBwT include a $1.8 billion direct appropriation increase for CDC to support the Emergency Ebola Response and Preparedness.
Out of the $11.8 billion Accounts Receivable increase, $11.0 billion is attributable to CMS. This is largely attributable to the $10.0 billion Accounts Receivable increase related to the Affordable Care Act. FY 2015 Other Assets, totaling $16.7 billion, consist of: Inventory and Related Property ($9.5 billion); General Property, Plant and Equipment (PP&E) ($5.9 billion); and Other Assets such as Travel Advances and Direct Loans (totaling $1.3 billion).
HHS reports PP&E exclusive of Stewardship Land, which comprises land held by IHS for providing health services to American Indians and Alaska Natives. HHS invests in other stewardship assets such as, Investments in Human Capital and in Research and Development. A discussion of stewardship assets is presented in Note 20 and in the “Required Supplementary Stewardship Information” within the “Financial Section.”
Liabilities
Our liabilities, or amounts that we owe from past transactions or events, were $151.4 billion on September 30, 2015. This represents an increase of $27.3 billion, or 22 percent more than the FY 2014 liabilities, primarily due to the Entitlement Benefits Due and Payable at CMS ($17.1 billion) for SMI, Medicaid, and Hospital Insurance (HI) claims Incurred But Not Reported (IBNR), and for the Risk Corridor, Reinsurance, and Risk Adjustment programs within the Affordable Care Act.
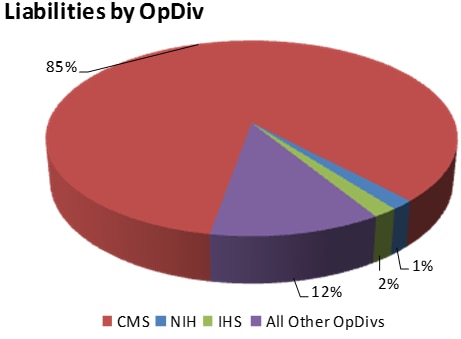

Accrued Liabilities increased by $11.0 billion, largely as a result of the addition of the FY 2015 liabilities related to the Reinsurance and Risk Adjustment programs associated with the Affordable Care Act ($10.4 billion).
Consistent with federal accounting standards, we recognize the responsibility for future program participants of Medicare as a social insurance program, rather than a pension program. Accordingly, we have not recognized a liability for future payments to current and future program participants. The estimated long-term cost for Medicare is included in the Statement of Social Insurance and discussed later in this analysis. A more extensive discussion is provided in the “Notes to the Principal Financial Statements” located in the “Financial Section” of this report.
Statement of Changes in Net Position
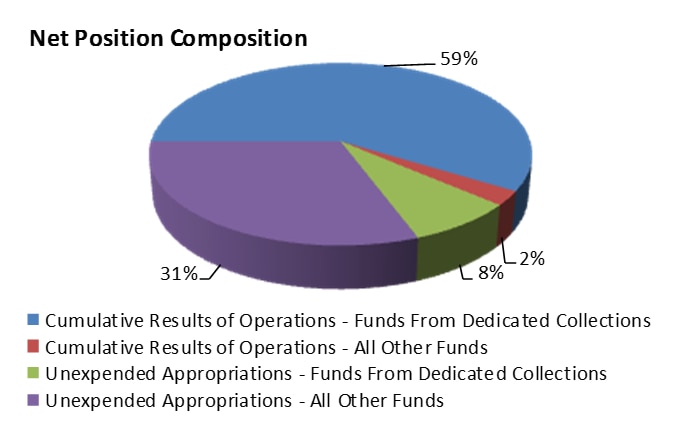
Our net position represents the difference between assets and liabilities. Changes in our net position result from changes that occur within the Cumulative Results of Operations and Unexpended Appropriations. Our net position increased by $19.2 billion (5 percent), from $358.2 billion in FY 2014 to $377.4 billion in FY 2015.
The net position increase of $19.2 billion is comprised of an increase in Funds From Dedicated Collections ($251.7 billion in FY 2015 compared to $243.8 billion in FY 2014) and an increase in All Other Funds ($125.8 billion in FY 2015 compared to $114.4 billion in FY 2014).
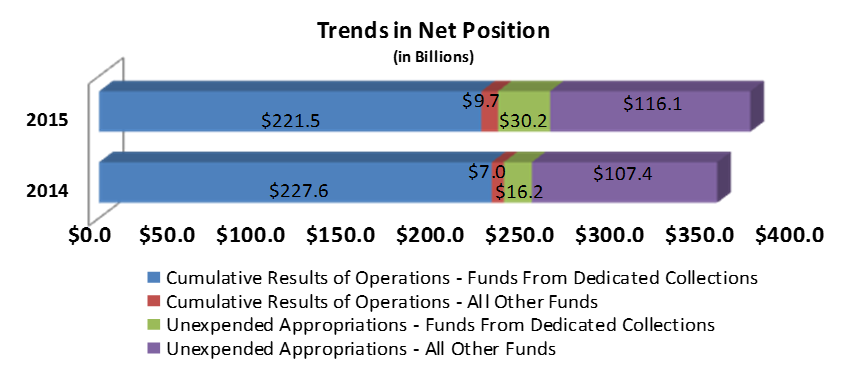
The significant changes within Unexpended Appropriations are primarily related to increases in Appropriations Received ($93.9 billion) and Appropriations Used ($80.4 billion) at CMS. These changes included an increase in Appropriations Received for Medicaid ($78.4 billion) and Medicare ($14.9 billion). Additionally, the OS received higher appropriations for the Community Health Center Fund and Public Health and Social Services Emergency Fund (mainly for Ebola response) for a $2.2 billion combined increase. The increase in Appropriations Used primarily relates to an increase of $46.1 million for Medicaid as a result of expansion associated with the Affordable Care Act.
Statement of Net Cost
Our Net Cost of Operations represents the difference between the costs incurred by our programs less associated revenues. We receive the majority of our funding through Congressional appropriations and reimbursement for the provision of goods or services to other federal agencies. Our Net Cost of Operations for the year ended September 30, 2015, totaled $1.0 trillion.

The table above presents our FY 2015 Consolidated Net Cost of Operations by responsibility segments (OpDivs). Gross costs less exchange revenue for CMS increased by $76.1 billion between FY 2015 and FY 2014. There was a nominal increase in total net cost of operations for the remaining HHS segments (excluding CMS) at approximately $1.9 billion. The majority of FY 2015 net costs relate to benefit expenses for CMS’s programs.
HHS classifies costs by major budget functions such as Medicare, Health, Education, and Income Security. The table below depicts consolidating costs by major budget function, comparatively between FY 2015 and FY 2014. Total costs for Medicare ($547.1 billion) and Health ($431.0 billion) programs account for almost 95 percent of our annual net costs. The Health budget function increased 12 percent ($47.6 billion), primarily due to increases in Medicaid. During FY 2015, the Medicare budget function increased 6 percent ($29.0 billion), primarily due to increases in the SMI benefit expenses and Medicare Part D administrative expenses. For more information on the budget functions, see the “Consolidating Statement of Net Cost by Budget Function” in the “Other Information” section of this report.
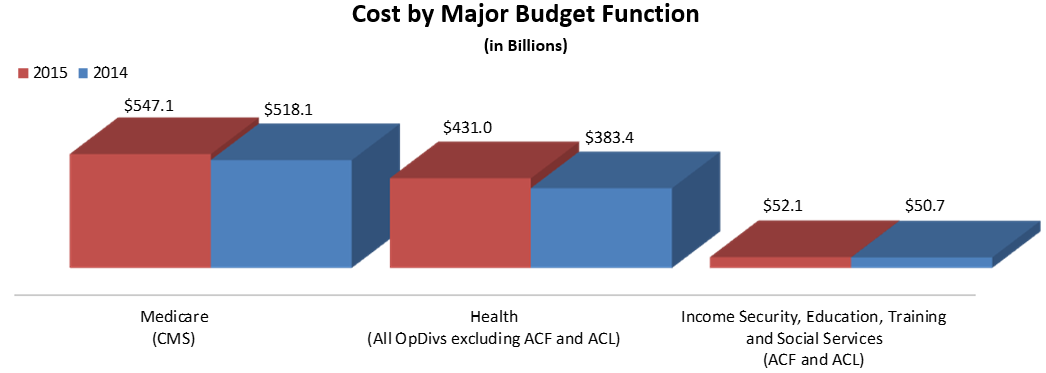
Statement of Budgetary Resources
The Combined Statement of Budgetary Resources provides information on availability of budgetary and non-budgetary resources at the end of the year. FY 2015 total resources were $1.5 trillion, representing an increase of $130.8 billion, or 9 percent, over FY 2014. Total obligations in FY 2015 were $1.5 trillion, an increase of $103.1 billion, or 8 percent as compared to FY 2014. These significant changes in resources are related primarily to the increase in funding for Medicare and Medicaid programs within CMS and the appropriations for Emergency Ebola Response and Preparedness and Public Health Service Evaluation funds at CDC. The chart below shows the percentage of budgetary resources by major programs. For further details, see the “Combining Statement of Budgetary Resources” in the “Financial Section” of this report.
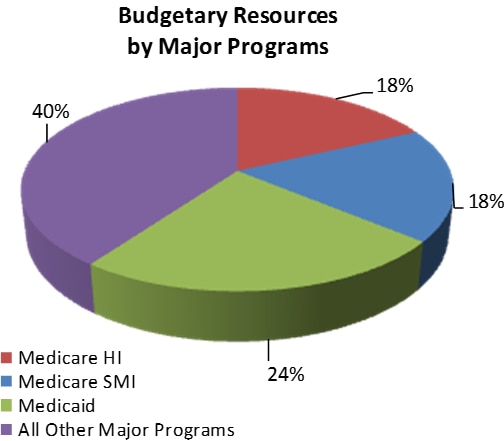
Schedule of Spending
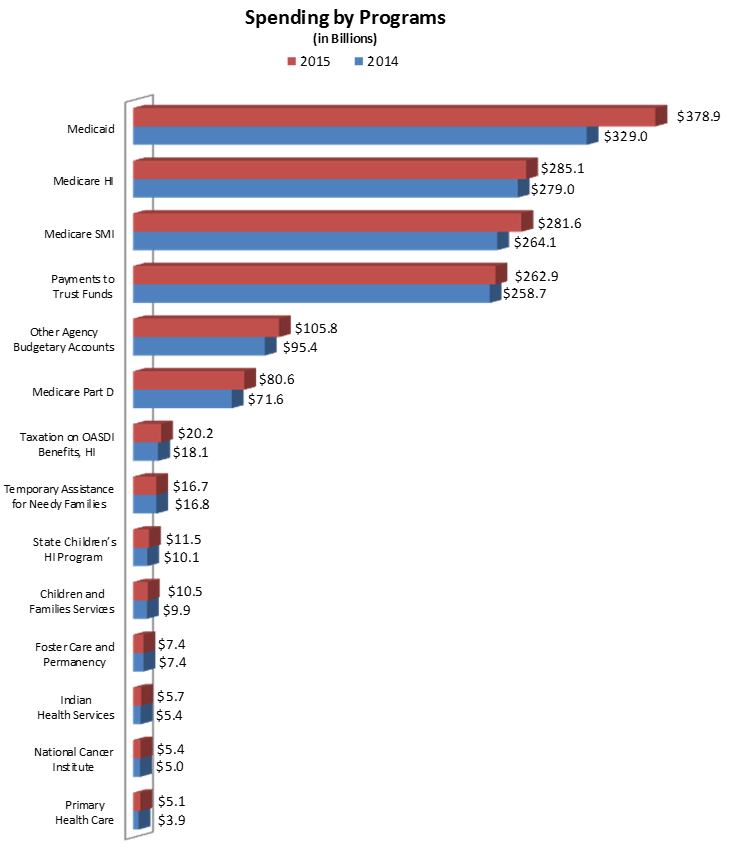
The Schedule of Spending (Note 23) presents an overview of how and where HHS has spent (obligated) money for the reporting period. The Chart to the right illustrates a summary of spending by select programs as of September 30, 2015 and 2014. Total obligations for this year were $1.5 trillion. This is an 8 percent increase over the $1.4 trillion in obligations for FY 2014.
Four major programs at CMS accounted for 82 percent of all HHS spending: Medicaid at 26 percent ($378.9 billion), Medicare HI at 19 percent ($285.1 billion), SMI at 19 percent ($281.6 billion), and Payments to Trust Funds 3 at 18 percent ($262.9 billion). The majority (91 percent) of all HHS spending was for Grants, Subsidies, and Contributions (47 percent) at $699.1 billion and Federal Assistance Direct Payments (44 percent) at $652.3 billion. For more information on services and items purchased, see the Combined Schedule of Spending by Object Class in the “Other Information” section of this report.
Statement of Social Insurance
The Statement of Social Insurance presents the 75-year actuarial present value of the income and expenditures of the HI and SMI Trust Funds. Future expenditures are expected to arise for current and future program participants. This projection is considered to be important information regarding the potential future cost of the program. These projected potential future obligations are not included in the Consolidated Balance Sheets, Statements of Net Cost and Changes in Net Position, or Combined Statement of Budgetary Resources.
Actuarial present values are computed under the intermediate set of assumptions specified in the Annual Report of the Medicare Board of Trustees. The basis for the projections in the Trustees Report has changed since last year due to the enactment of the Medicare Access and CHIP Reauthorization Act (MACRA) of 2015. This law repealed the sustainable growth rate (SGR) formula that set physician fee schedule payments, which were usually modified, and replaced it with specified payment updates for physicians. The projections shown in last year’s Trustees report reflected a projected baseline scenario, which assumed an override of the SGR payment provisions. With the enactment of MACRA, the projections in this year’s report are based on current law (for more information, see Notes 24 and 25 of the “Financial Section”).
The Statement of Social Insurance presents the following estimates:
· The present value of future income (income excluding interest) to be received from or on behalf of current participants who have attained eligibility age and the future cost of providing benefits to those same individuals;
· The present value of future income to be received from or on behalf of current participants who have not yet attained eligibility age and the future cost of providing benefits to those same individuals;
· The present value of future income less future cost for the closed group, which represents all current participants who attain age 15 or older in the first year of the projection period, plus the assets in the combined HI and SMI Trust Funds as of the beginning of the valuation period;
· The present value of income to be received from or on behalf of future participants and the cost of providing benefits to those same individuals;
· The present value of future income less future cost for the open group, which represents all current and future participants (including those born during the projection period) who are now participating or are expected to eventually participate in the Medicare program, plus the assets in the combined HI and SMI Trust Funds as of the beginning of the valuation period; and
- The present value of future cash flows for all current and future participants over the next 75 years (open group measure) increased from $(3.8) trillion, determined as of January 1, 2014, to $(3.2) trillion, determined as of January 1, 2015.
Including the combined HI and SMI Trust Fund assets increases the present value, as of January 1, 2015, of future cash flow for all current and future participants to $(2.9) trillion for the 75-year valuation period. The comparable closed group of participants, including the combined HI and SMI Trust Fund assets, is $(8.6) trillion.
HI Trust Fund Solvency
Pay-as-you-go Financing
The HI Trust Fund is deemed to be solvent as long as assets are sufficient to finance program obligations. Such solvency is indicated, for any point in time, by the maintenance of positive trust fund assets. In recent years, current expenditures have exceeded program income for the HI program, and thus, the HI Trust Fund assets have been declining. The table below shows the HI Trust Fund assets, expressed as a ratio of the assets at the beginning of the FY to the expenditures for the year. This ratio has steadily dropped from 107 percent at the beginning of FY 2011 to 74 percent at the beginning of FY 2015.

Short-Term Financing
The HI Trust Fund is deemed adequately financed for the short-term when actuarial estimates of trust fund assets for the beginning of each calendar year are at least as large as program obligations for the year. Estimates in the 2015 Trustees Report indicate that the HI Trust Fund is not adequately financed over the next 10 years. Under the intermediate assumptions of the 2015 Trustees Report, the HI Trust Fund ratio is estimated to continue decreasing through the beginning of 2017 and remain at approximately 70 percent through 2022. From the end of 2014 to the end of 2024, assets are expected to increase, from $197.3 billion to $290.0 billion.
Long-Term Financing
The short-range outlook for the HI Trust Fund is about the same as projected last year. After 2022, the trust fund ratio starts to decline quickly until the fund is depleted in 2030, the same date projected last year. HI financing is not projected to be sustainable over the long term with the tax rates and expenditure levels projected. Program cost exceeded total income in 2014, and thereafter, income is projected to exceed costs for several years before falling below it in 2024 and later. When the HI Trust Fund is exhausted, full benefits cannot be paid on a timely basis. The percentage of expenditures covered by tax revenues is projected to decrease from 86 percent in 2030 to 79 percent in 2039 and then to increase to about 84 percent by the end of the projection period.
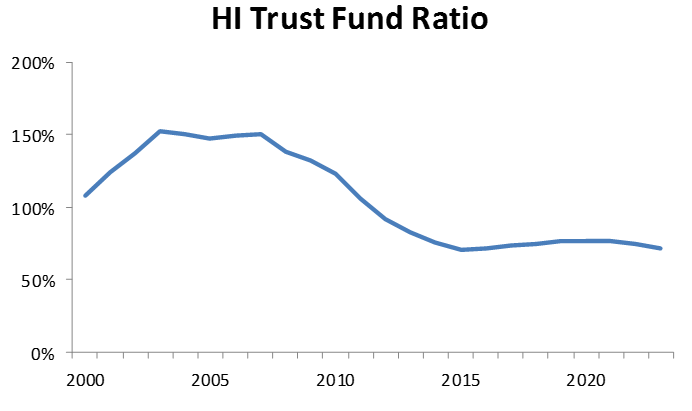
The primary reasons for the projected long-term inadequacy of financing under current law relate to the fact that the ratio of the number of workers paying taxes relative to the number of beneficiaries eligible for benefits drops from 3 percent in 2014 to about 2 percent by 2089. In addition, health care costs continue to rise faster than the taxable wages used to support the program. In present value terms, the 75-year shortfall is $3.0 trillion, which is less than 1 percent of taxable payroll and Gross Domestic Product (GDP) over the same period.
Significant uncertainty surrounds the estimates for the Statement of Social Insurance. In particular, the actual future values of demographic, economic, and programmatic factors are likely to be different from the near-term and ultimate assumptions used in the projections. The Trustees assume that the various cost-reduction measures—the most important of which are the reductions in the annual payment rate updates for all categories of Part A providers by the growth in economy-wide private nonfarm business multifactor productivity—will occur as the Affordable Care Act requires. The Trustees believe that this outcome is achievable if health care providers are able to realize productivity improvements at a faster rate than experienced historically. However, if the health sector cannot transition to more efficient models of care delivery and achieve productivity increases commensurate with economy-wide productivity, and if the provider reimbursement rates paid by commercial insurers continue to follow the same negotiated process used to date, then the availability and quality of health care received by Medicare beneficiaries would, under current law, fall over time relative to that received by those with private health insurance.
SMI Trust Fund Solvency
The SMI Trust Fund consists of two accounts – Part B and Part D. In order to evaluate the financial status of the SMI Trust Fund, each account needs to be assessed individually, since financing rates for each part are established separately, and their program benefits are quite different in nature.
While differences between the two accounts exist, the financing mechanism for each part is similar in that the financing is determined on a yearly basis. The Part B account is generally financed by premiums and general revenue matching appropriations determined annually to cover projected program expenditures and to provide a contingency for unexpected program variation. The Part D account is financed by premiums, general revenues, and transfers from state governments. Unlike the Part B account, Part D appropriation has generally included an indefinite authority provision allowing for amounts to be transferred to the Part D account on an as-needed basis. This provision allows previously apportioned amounts to change without additional Congressional action if those amounts are later determined to be insufficient. Consequently, once an appropriation with this provision has been made, no deficit will occur in the Part D account, and no contingency fund will be necessary to cover deficits.
Since both the Part B and Part D programs are financed on a yearly basis, from a program perspective, there is no unfunded liability in the short or long-range. Therefore, in this financial statement the present value of estimated future excess of income over expenditures for current and future participants over the next 75 years is $0. However, from a government-wide perspective, General Fund transfers as well as interest payments to the Medicare Trust Funds and asset redemption, represent a draw on other federal resources for which there is no earmarked source of revenue from the public. Hence, from a government-wide perspective, the corresponding estimate of future income less expenditures for the 75-year projection period is $(24.8) trillion.
Even though from a program perspective, the unfunded liability is $0, there is concern over the rapid growth in SMI expenditures as a percent of GDP. In 2014, SMI expenditures were 2 percent of GDP. By 2089, SMI expenditures are projected to grow to 4 percent of the GDP. The table below presents key amounts from CMS’s basic financial statements for FY 2013 through 2015.
Table of Key Measures 4
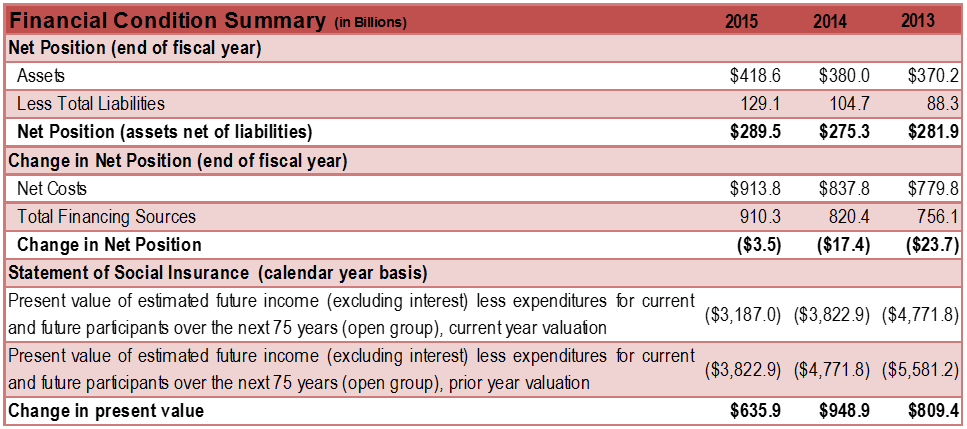
Statement of Changes in Social Insurance Amounts
The Statement of Changes in Social Insurance Amounts reconciles the change (between the current valuation period and the prior valuation period) in the present value of future tax income less future cost for current and future participants (the open group measure) over the next 75 years. This reconciliation identifies those components of the change that are significant and provides reasons for the changes. In general, an increase in the present value of net cash flow represents a positive change (improving financing), while a decrease in the present value of net cash flow represents a negative change (worsening financing).
The present value as of January 1, 2015, would have decreased by $202.2 billion due to advancing the valuation date by one year and including the additional year 2089, by $82.1 billion due to changes in the projection base, and by $35.2 billion due to the changes in demographic assumptions. However, changes in economic and health care assumptions and legislation changes increased the present value of future cash flows by $754.6 billion and $200.8 billion, respectively.
Required Supplementary Information
As required by Statement of Federal Financial Accounting Standards (SFFAS) Number 17, Accounting for Social Insurance (as amended by SFFAS Number 37, Social Insurance: Additional Requirements for Management Discussion and Analysis and Basic Financial Statements), CMS has included information about the Medicare trust funds – HI and SMI. The “Required Supplementary Information” section presents required long-range cash flow projections, the long-range projections of the ratio of contributors to beneficiaries (dependency ratio), and the sensitivity analysis illustrating the effect of the changes in the most significant assumptions on the actuarial projections and present values. The SFFAS 37 does not eliminate or otherwise affect the SFFAS 17 requirements for the supplementary information, except that actuarial projections of annual cash flow in nominal dollars are no longer required; as such, it will not be reported in the “Required Supplementary Information” section. The “Required Supplementary Information” section assesses the sufficiency of future budgetary resources to sustain program services and meet program obligations as they come due. The information is drawn from the 2015 Annual Report of the Boards of Trustees of the Federal Hospital Insurance and Federal Supplementary Medical Insurance Trust Funds, which represents the official government evaluation of the financial and actuarial status of the Medicare Trust Funds.
Limitation of the Principal Financial Statements
The principal financial statements in the “Financial Section” have been prepared to report our financial position and results of operations, pursuant to the requirements of 31 U.S.C. §3515(b). Although the statements have been prepared from our books and records in accordance with GAAP for federal entities and the formats prescribed by the OMB, the statements are in addition to the financial reports used to monitor and control budgetary resources, which are prepared from the same books and records.
The statements should be read with the realization that they are for a component of the U.S. Government, a sovereign entity. One implication of this is that liabilities cannot be liquidated without legislation providing HHS with resources and budget authority.
Also see these sections of the Agency Financial Report:
- Section II: Financial Section
- Section III: Other Information
- Appendices
Return to AFR Homepage
[1] The reporting frequency for this measure is semi-annually. A new CAUTI definition went into effect in January 2015; therefore, this chart only presents results and baseline data prior to January 2015. Outstanding data and a new baseline are expected in March 2016.
[2] Data results were not available at the time of publication. Results should be available in the FY 2017 Annual Performance Plan and Report published in February 2016.
[3] Payments to Trust Funds include appropriations resulting from the Social Security Act,Health Insurance Portability and Accountability Act of 1996 (HIPAA), and Medicare Prescription Drug, Improvement and Modernization Act of 2003 (MMA) legislation to provide payments to HI and SMI trust funds.
[4] The Table or other singular presentation showing the measures described above. Although, the closed group measure is not required to be presented in the table or other singular presentation, the CMS presents the closed group measure and open group measure.

